. 2010 Feb 11;115(6):1175-84.
doi: 10.1182/blood-2009-04-214718. Epub 2009 Dec 11.

Acute T-cell leukemias remain dependent on Notch signaling despite PTEN and INK4A/ARF loss

Affiliations

Acute T-cell leukemias remain dependent on Notch signaling despite PTEN and INK4A/ARF loss

Hind Medyouf et al. Blood. .

Abstract

NOTCH1 is activated by mutation in more than 50% of human T-cell acute lymphoblastic leukemias (T-ALLs) and inhibition of Notch signaling causes cell-cycle/growth arrest, providing rationale for NOTCH1 as a therapeutic target. The tumor suppressor phosphatase and tensin homolog (PTEN) is also mutated or lost in up to 20% of cases. It was recently observed among human T-ALL cell lines that PTEN loss correlated with resistance to Notch inhibition, raising concern that patients with PTEN-negative disease may fail Notch inhibitor therapy. As these studies were limited to established cell lines, we addressed this issue using a genetically defined mouse retroviral transduction/bone marrow transplantation model and observed primary murine leukemias to remain dependent on NOTCH1 signaling despite Pten loss, with or without additional deletion of p16(Ink4a)/p19(Arf). We also examined 13 primary human T-ALL samples obtained at diagnosis and found no correlation between PTEN status and resistance to Notch inhibition. Furthermore, we noted in the mouse model that Pten loss accelerated disease onset and produced multiclonal tumors, suggesting NOTCH1 activation and Pten loss may collaborate in leukemia induction. Thus, in contrast to previous findings with established cell lines, these results indicate PTEN loss does not relieve primary T-ALL cells of their "addiction" to Notch signaling.


Figures

Figure 1
Figure 1
Loss of Pten accelerates NOTCH1-induced leukemia. (A) Kaplan-Meier T-cell leukemia survival curves. Bone marrow from mice of indicated genotypes was transduced with mutated NOTCH1 (L1601P-ΔPEST) or empty retrovirus and transplanted into irradiated recipients. Median survivals are as follows: L1601P-ΔPEST retrovirus on Ptenwt Ink4a/Arfwt (81.5 days, n = 6), Ptenf/f Ink4a/Arfwt Mx1-Cre (35 days, n = 4), Ptenf/f Ink4a/Arf f/f Mx1-Cre (34 days, n = 12), and Ptenwt Ink4a/Arff/f Mx1-Cre (86.5 days, n = 2; 3 additional mice in cohort died of nonhematologic neoplasms) backgrounds; empty virus on Ptenf/f Ink4a/Arfwt Mx1-Cre background (153.5 days, n = 4). Indicated pairwise comparisons are significantly different (*log-rank test, P < .007). (B-C) Flow cytometric analysis of Pten protein expression (B) and CD4/CD8 phenotype (C) in GFP+ splenic cells from L1601P-ΔPEST leukemias on Ptenf/f Ink4a/Arfwt Mx1-Cre (7-x series) and Ptenwt Ink4a/Arfwt (3-x series) backgrounds. Analysis of bone marrow cells showed similar results (data not shown). (D) Tumor burden in spleen and liver as measured by whole organ weight and GFP+ fraction is not significantly different between Pten-null and wild-type background leukemias (Student t test). (E) Clonality assessment by TCRβ rearrangement and proviral integration site analysis. Dominant single bands indicative of monoclonality are highlighted by asterisk (*). Normal tissue samples including wild-type thymus (WT Thy) and uninvolved bone marrow (uBM) represent “polyclonal” controls for comparison. ThyL indicates thymic lymphoma; MW, molecular weight marker; and GL, germline. DNA was prepared from either bone marrow or spleen for cases of disseminated leukemia. Each numbered sample represents a different individual transplant recipient mouse. Please note, L1601P-ΔPEST is abbreviated as L1601PdP in the figure labels. Ink4a-Arf is abbreviated as INK4A in the figure labels.
Figure 2
Figure 2
Murine NOTCH1 leukemias lacking Pten remain dependent on Notch signaling and are GSI sensitive. (A) Proliferation and (B) cell size analysis of primary mouse L1601P-ΔPEST leukemias on wild-type (WT) and Pten/Ink4a/Arf-null backgrounds treated with γ-secretase inhibitor (GSI) to block Notch signaling. Freshly explanted primary leukemia cells from different individual mice were cultured in vitro for 3 days with GSI (1μM compound E) or DMSO vehicle, pulsed with BrdU, and assayed by flow cytometry. Proliferation results are summarized from data plots presented in supplemental Figure 4. FSC indicates forward light scatter; ns, nonsignificant (Student t test). (C) Spontaneous loss of Pten protein expression occurred in one case (mouse nos. 3-7 as in Figure 1B) after 29 days of culture in vitro, yet it remained GSI sensitive. Pten protein expression was assessed by flow cytometry (right panel), and GSI response assayed by BrdU incorporation (left panel). Pten mRNA was detected by RT-PCR at both day 0 and day 29, and sequencing revealed no loss-of-function mutations (data not shown). Please note, only gated GFP+ events are depicted.
Figure 3
Figure 3
Murine NOTCH1 leukemias lacking both Pten and Ink4a/Arf remain dependent on Notch signaling and are GSI sensitive. (A) PCR analysis confirming homozygous deletion of both Ink4a/Arf (upper panel) and Pten (bottom panel) loci in L1601P-ΔPEST leukemias derived from Ptenf/f Ink4a/Arff/f Mx1-Cre bone marrow (n = 7). Analysis of 5-FU–treated bone marrow revealed a subpopulation of progenitors already deleted for Ink4a/Arf and/or Pten prior to retroviral transduction. (B) In vitro proliferation analysis of primary mouse L1601P-ΔPEST leukemias on Pten, Ink4a/Arf double-null background treated with GSI as in Figure 2A. Primary leukemia cells from 5 individual mice were assayed. Only gated GFP+ events are depicted. (C) In vivo assay for GSI sensitivity confirms in vitro results. Splenic tumor cells from a single Pten, Ink4a/Arf double-null L1601P-ΔPEST primary leukemia were serially transplanted by tail vein injection into secondary recipients. At day 3 after transplantation, mice were treated by intraperitoneal injection with GSI (100 mg/kg per day DAPT) for 1 day (n = 5) or 2 days (n = 3), or DMSO vehicle only (n = 4). Animals were then killed on day 3 after treatment initiation (day 6 after transplantation) and extent of tumor infiltration in liver was assessed by automated image analysis of H&E histology. Each data point represents a separately imaged histologic field; 3 fields were examined per mouse. Significantly fewer blasts were observed in GSI-treated mice (P < .001; 1-way analysis of variance with posttest linear trend analysis).
Figure 4
Figure 4
Primary human T-ALL cells are GSI sensitive regardless of PTEN status. In vitro proliferation and cell size analysis of primary human T-ALL samples maintained briefly (up to 6 days) on either MS5/MS5-DL1 murine stromal feeder cells (A,C) or immobilized Delta1 ligand (Delta1ext-IgG; B), and then treated with GSI (1μM compound E or 10μM DAPT) versus DMSO vehicle for 4 days. At the end of the treatment period, cultures were pulsed with BrdU and assayed by flow cytometry. Human T-ALL cells were discriminated from murine cells by costaining with hCD45. Each plotted data point in panels A and C represents a different primary human sample. Results are summarized from individual data plots presented in supplemental Figure 7. FSC indicates forward light scatter; ns, nonsignificant (Student t test).
Figure 5
Figure 5
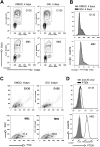
Infrequent GSI-resistant primary human T-ALL samples include both PTEN-positive and -negative cases. In vitro analysis of 2 primary human T-ALL samples (D135 and M82) maintained briefly (2 days) on MS5-DL1 stromal feeders and then treated with GSI (1μM compound E) versus DMSO vehicle for 4 days. Cells were analyzed as in Figure 4 for proliferation (A), cell size (B), and viability by light scatter (C). PTEN protein expression was assessed by intracellular flow cytometry (D). FSC indicates forward light scatter; SSC, side scatter.

Similar articles

Cited by

References

    1. Maillard I, Fang T, Pear WS. Regulation of lymphoid development, differentiation, and function by the Notch pathway. Annu Rev Immunol. 2005;23:945–974. - PubMed
    1. Grabher C, von Boehmer H, Look AT. Notch 1 activation in the molecular pathogenesis of T-cell acute lymphoblastic leukaemia. Nat Rev Cancer. 2006;6(5):347–359. - PubMed
    1. Aster JC, Pear WS, Blacklow SC. Notch signaling in leukemia. Annu Rev Pathol. 2008;3(1):587–613. - PMC - PubMed
    1. Weng AP, Ferrando AA, Lee W, et al. Activating mutations of NOTCH1 in human T cell acute lymphoblastic leukemia. Science. 2004;306(5694):269–271. - PubMed
    1. Malecki MJ, Sanchez-Irizarry C, Mitchell JL, et al. Leukemia-associated mutations within the NOTCH1 heterodimerization domain fall into at least two distinct mechanistic classes. Mol Cell Biol. 2006;26(12):4642–4651. - PMC - PubMed

Publication types

MeSH terms