

Comparing and ranking hospitals based on outcome: results from The Netherlands Stroke Survey
- PMID: 20008321
- PMCID: PMC2810392
- DOI: 10.1093/qjmed/hcp169
Comparing and ranking hospitals based on outcome: results from The Netherlands Stroke Survey
Abstract
Background: Measuring quality of care and ranking hospitals with outcome measures poses two major methodological challenges: case-mix adjustment and variation that exists by chance.
Aim: To compare methods for comparing and ranking hospitals that considers these.
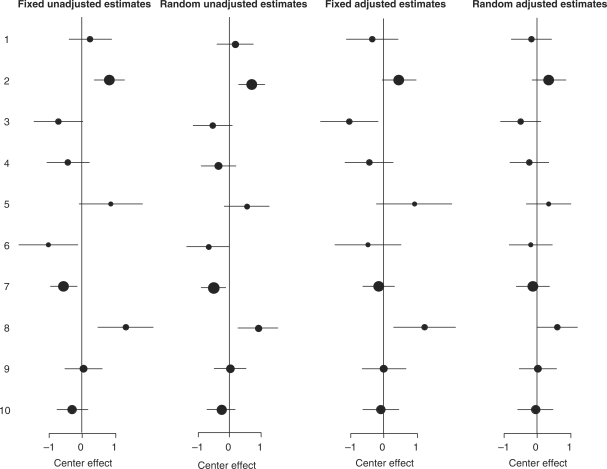
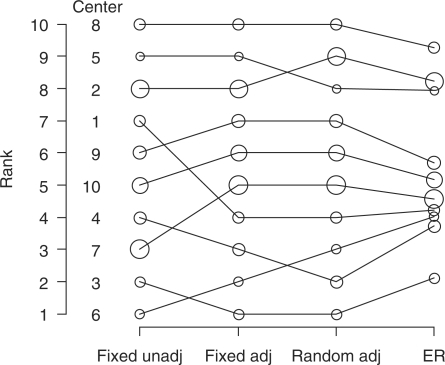
Methods: The Netherlands Stroke Survey was conducted in 10 hospitals in the Netherlands, between October 2002 and May 2003, with prospective and consecutive enrollment of patients with acute brain ischaemia. Poor outcome was defined as death or disability after 1 year (modified Rankin scale of > or =3). We calculated fixed and random hospital effects on poor outcome, unadjusted and adjusted for patient characteristics. We compared the hospitals using the expected rank, a novel statistical measure incorporating the magnitude and the uncertainty of differences in outcome.
Results: At 1 year after stroke, 268 of the total 505 patients (53%) had a poor outcome. There were substantial differences in outcome between hospitals in unadjusted analysis (chi(2) = 48, 9 df, P < 0.0001). Adjustment for 12 confounders led to halving of the chi(2) (chi(2) = 24). The same pattern was observed in random effects analysis. Estimated performance of individual hospitals changed considerably between unadjusted and adjusted analysis. Further changes were seen with random effect estimation, especially for smaller hospitals. Ordering by expected rank led to shrinkage of the original ranks of 1-10 towards the median rank of 5.5 and to a different order of the hospitals, compared to ranking based on fixed effects.
Conclusion: In comparing and ranking hospitals, case-mix-adjusted random effect estimates and the expected ranks are more robust alternatives to traditional fixed effect estimates and simple rankings.
Figures
References
-
- Green J, Wintfeld N. Report cards on cardiac surgeons. Assessing New York state's; approach. N Engl J Med. 1995;332:1229–32. - PubMed
-
- Wang W, Dillon B, Bouamra O. An analysis of hospital trauma care performance evaluation. J Trauma. 2007;62:1215–22. - PubMed
-
- Shahian DM, Normand SL, Torchiana DF, Lewis SM, Pastore JO, Kuntz RE, et al. Cardiac surgery report cards: comprehensive review and statistical critique. Ann Thorac Surg. 2001;72:2155–68. - PubMed
-
- Goldstein H, Spiegelhalter DJ. League tables and their limitations: statistical issues in comparisons of institutional performance. J R Stat Soc Ser A. 1996;159:385–443.
Publication types
MeSH terms
Grants and funding
LinkOut - more resources
Full Text Sources
Medical
Miscellaneous
