. 2010 Feb 19;285(8):5802-14.
doi: 10.1074/jbc.M109.068130. Epub 2009 Dec 12.

Molecular insights into mammalian end-binding protein heterodimerization

Affiliations

Molecular insights into mammalian end-binding protein heterodimerization

Christian O De Groot et al. J Biol Chem. .

Abstract

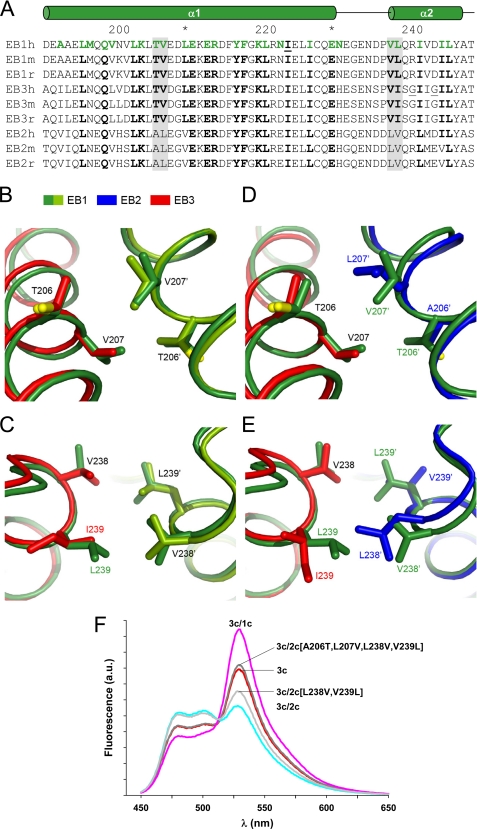
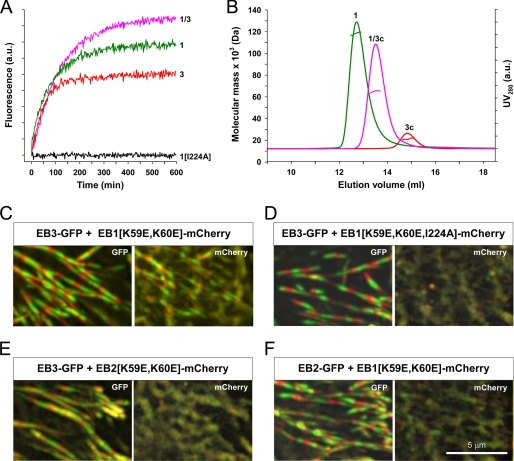
Microtubule plus-end tracking proteins (+TIPs) are involved in many microtubule-based processes. End binding (EB) proteins constitute a highly conserved family of +TIPs. They play a pivotal role in regulating microtubule dynamics and in the recruitment of diverse +TIPs to growing microtubule plus ends. Here we used a combination of methods to investigate the dimerization properties of the three human EB proteins EB1, EB2, and EB3. Based on Förster resonance energy transfer, we demonstrate that the C-terminal dimerization domains of EBs (EBc) can readily exchange their chains in solution. We further document that EB1c and EB3c preferentially form heterodimers, whereas EB2c does not participate significantly in the formation of heterotypic complexes. Measurements of the reaction thermodynamics and kinetics, homology modeling, and mutagenesis provide details of the molecular determinants of homo- versus heterodimer formation of EBc domains. Fluorescence spectroscopy and nuclear magnetic resonance studies in the presence of the cytoskeleton-associated protein-glycine-rich domains of either CLIP-170 or p150(glued) or of a fragment derived from the adenomatous polyposis coli tumor suppressor protein show that chain exchange of EBc domains can be controlled by binding partners. Extension of these studies of the EBc domains to full-length EBs demonstrate that heterodimer formation between EB1 and EB3, but not between EB2 and the other two EBs, occurs both in vitro and in cells as revealed by live cell imaging. Together, our data provide molecular insights for rationalizing the dominant negative control by C-terminal EB domains and form a basis for understanding the functional role of heterotypic chain exchange by EBs in cells.


Figures

FIGURE 1.
FIGURE 1.
Heterodimerization of EBc domains. A, a schematic diagram shows FRET of dimeric EBc domains that are N-terminal-tagged with fluorescence proteins. CFP absorbs light at 434 nm and emits light at 477 nm. YFP absorbs light at 514 nm and emits light at 527 nm. When brought in close proximity, for example, through the coiled-coil domains of EBc dimers, energy absorbed by CFP is transferred to YFP through nonradiative FRET and emitted by YFP. B, shown are fluorescence emission spectra obtained by mixing equimolar amounts of CFP-EB1c and YFP-EB1c (10 μm each) at 37 °C and recorded at 60-min time intervals with excitation at 434 nm. Red and green indicate spectra obtained after 0- and 600-min incubation times, respectively. Note that the fluorescence emission signal at 527 nm observed at time 0 is due to background FRET in the sample (supplemental Fig. 3). a.u., arbitrary units. C, shown is time-dependent increase of the fluorescence signal at 527 nm (excitation at 434 m) after mixing equimolar amounts (10 μm each) of CFP-EB1c and YFP-EB1c (1c), CFP-EB2c and YFP-EB2c (2c), CFP-EB3c and YFP-EB3c (3c), CFP-EB1c and YFP-EB2c (1c/2c), CFP-EB1c and YFP-EB3c (1c/3c), CFP-EB2c and YFP-EB3c (2c/3c), and CFP-EB1c(I224A) and YFP-EB1c(I224A) (1c(I224A)) at 37 °C. D, shown is titration of 10 μm CFP-EB1c with increasing amounts of YFP-EB3c. The data show the loss of intensity of the fluorescence signal at 477 nm due to the dequenching of CFP-EB1c homodimers because of EB1c·EB3c heterodimer formation. Samples were incubated at 37 °C for 16 h before each measurement.
FIGURE 2.
FIGURE 2.
Thermodynamic and kinetic properties of EBc domains. A, shown is isothermal urea-induced unfolding at 25 °C with 40 μm protein. Experimental data are represented by circles. Continuous lines show the best fits obtained assuming a monomer-dimer equilibrium model. B, shown is thermal unfolding with 50 μm protein. This is the same presentation as in A. C, urea dependence of the rate constants for refolding (solid symbols) and unfolding (open symbols) at 25 °C was measured by stopped-flow CD experiments. The rate constants under native conditions were calculated by extrapolation of the linear regression lines to 0 m urea. In all panels the data are color-coded: green, EB1c (1c); blue, EB2c (2c); red, EB3c (3c); brown, EB3c(G241R,G244D). The data shown correspond to the mean residue ellipticities at 222 nm (A and B) or at 225 nm (C).
FIGURE 3.
FIGURE 3.
Structural analysis of EBc domains. A, shown is multiple sequence alignment of human (h), murine (m), and rat (r) EB1c, EB2c, and EB3c. Residues of EB1c involved in interchain interactions (based on PDB entry 1WU9) are highlighted in green, and their size conservation among similar residue types is indicated in bold. The locations of the helices α1 and α2 in the structure of the EB1c homodimer and the residue numbering of EB1c are indicated above the alignment. The sites investigated in the mutational study (panel F) are shaded in gray; Gly-241 and Gly-244 in EB3h and Ile-224 in EB1h are underlined. All residue positions are given according to the alignment with the EB1h sequence. B and C, close-up views of the model of the human EB1c·EB3c heterodimer (EB1c and EB3c chains are depicted in light green and red, respectively) superimposed onto the crystal structure of the human EB1c homodimer (depicted in dark green). The main chains are shown as ribbons, and the interacting side chains are in stick representation. The labels are in the color of the corresponding chains or in black when the same residue occurs in both superimposed chains. Panel B shows the dipeptide segment 1, and panel C shows the dipeptide segment 2 (see text). D and E, shown is a close-up view of the model of the human EB2c·EB3c heterodimer (EB2c and EB3c chains depicted in blue and red, respectively) superimposed onto the crystal structure of the human EB1c homodimer (depicted in dark green). Panel D shows dipeptide segment 1, and panel E shows dipeptide segment 2. The residue numbering is according to the EB1 sequence (see panel A). Oxygen atoms of side chains in the panels B to E are indicated in yellow. F, the effect of mutations in EB2c on chain exchange with EB3c is shown. Fluorescence emission spectra (excitation at 434 nm) recorded from equimolar mixtures (10 μm each) of CFP-EB3c with YFP-EB1c (3c/1c, magenta), YFP-EB2c (3c/2c, cyan), YFP-EB3c (3c, red), YFP-EB2c(L238V,V239L) (3c/2c(L238V,V239L), gray) and YFP-EB2c(A206T,L207V,L238V,V239L) (3c/2c(A206T,L207V,L238V,V239L), dark gray). Samples were incubated at 37 °C for 16 h before data acquisition. a.u., arbitrary units.
FIGURE 4.
FIGURE 4.
Effect of binding partners on EB1c chain exchange. A, shown is the time-dependent increase of the fluorescence signal at 527 nm (excitation at 434 m) after mixing equimolar amounts (10 μm each) of CFP-EB1c and YFP-EB1c at 37 °C in the absence of a binding partner and in the presence of either 591 μm ClipCG2, 65 μm p150CG, 23 μm p150CG(A49M), or 116 μm APCp1. The concentrations of the EB1c binding partners have been adjusted so that 95% of the EB1c is present in complexed form when taking the Kd values of the individual binding partners into account (15, 33). a.u., arbitrary units. B, shown are amide 1H exchange protection factors of EB1c in the absence (blue) and presence (red) of an equimolar amount of APCp1. No data are shown for residues 207, 211, and 215 in the complex because of resonance overlap and for the residues 237, 256, and 261 in both data sets because these residues are prolines. Residues 191–208 and 231–241 from the free EB1c and residues 191–202, 231–241, and 249–268 from EB1c in complex with APCp1 are not shown because their amide protons have completely exchanged before the first experiment could be started (about 10 min), corresponding to log p values ≤3. The locations of the helices α1 and α2 in the structure of the EB1c homodimer (PDB entry 1WU9) are indicated. C, shown is the location of slowly exchanging amide hydrogens in the structure of the free EB1c dimer (left) and the EB1c dimer in complex with a peptide derived from the microtubule-actin cross-linking factor (right), which was shown to form a closely similar complex to the one with APCp1 (14). The backbone is shown in gray, and selected residue positions are indicated. The exchange data are represented by color-coded spheres at the position of the backbone N atoms: light blue, fast exchanging 1H, not observed in the first exchange spectrum; yellow, log p < 4; orange, log p = 4.0–5.0; red, log p > 5. The locations of the bound peptides are indicated by a green tube representing a spline function through the Cα atom coordinates.
FIGURE 5.
FIGURE 5.
Heterodimerization of full-length EB1 and EB3. A, shown is the time-dependent increase of the fluorescence signal at 527 nm (excitation at 434 m) after mixing equimolar amounts (10 μm each) of EB1-CFP and EB1-YFP (1), EB3-CFP and EB3-YFP (3), EB1-CFP and EB3-YFP (1/3), and EB1(I224A)-CFP and EB1(I224A)-YFP (1(I224A)) incubated at 37 °C. B, shown are SLS-SEC experiments of EB1-CFP (1), EB3c (3c), and a mixture of EB1-CFP and EB3c (1/3c) that has been incubated for 16 h at 37 °C. Molecular mass determination (colored horizontal lines located below the maximum of each peak) yielded values of 118.2 kDa for EB1-CFP, 18.2 kDa for EB3c, and 68.0 kDa for EB1-CFP/EB3c. a.u., arbitrary units. C–F, heterodimerization of full-length EB proteins in cells is shown. Chinese hamster ovary cells were co-transfected with short hairpin RNA plasmids to deplete endogenous EB1 and EB3 and co-transfected with the indicated combination of fluorescent protein-tagged EBs. GFP and mCherry fluorescence were imaged simultaneously using total internal reflection fluorescence (TIRF) microscopy. Images were obtained at 0.5-s intervals, and 5 consecutive frames were averaged. Each panel shows a maximum intensity projection of 20 averaged frames, where each odd frame is shown in green, and each even frame is in red. Growing microtubule ends appear in this representation as rows of alternating green and red dashes. Note that EB3-GFP and EB2-GFP display robust plus-end tracking. EB1(K59E,K60E)-mCherry is recruited to plus ends by EB3-GFP (C). The I224A mutation, which interferes with dimerization of EB1(K59E,K60E,I224A)-mCherry, abrogates recruitment by EB3-GFP (D). EB3-GFP does not recruit EB2(K59E,K60E)-mCherry (E). In contrast to EB3-GFP(C), EB2-GFP fails to recruit EB1(K59E,K60E)-mCherry to growing microtubule ends (F).

Similar articles

Cited by

References

    1. Desai A., Mitchison T. J. (1997) Annu. Rev. Cell Dev. Biol. 13, 83–117 - PubMed
    1. Howard J., Hyman A. A. (2003) Nature 422, 753–758 - PubMed
    1. Schuyler S. C., Pellman D. (2001) Cell 105, 421–424 - PubMed
    1. Akhmanova A., Steinmetz M. O. (2008) Nat. Rev. Mol. Cell Biol. 9, 309–322 - PubMed
    1. Tirnauer J. S., Bierer B. E. (2000) J. Cell Biol. 149, 761–766 - PMC - PubMed

Publication types

MeSH terms

LinkOut - more resources