

Review
doi: 10.1098/rstb.2009.0164.
Ecological science and tomorrow's world
Affiliations
- PMID: 20008384
- PMCID: PMC2842703
- DOI: 10.1098/rstb.2009.0164
Item in Clipboard
Review
Ecological science and tomorrow's world
Philos Trans R Soc Lond B Biol Sci.
.
Abstract
Beginning with an outline of uncertainties about the number of species on Earth today, this paper addresses likely causes and consequences of the manifest acceleration in extinction rates over the past few centuries. The ultimate causes are habitat destruction, alien introductions, overexploitation and climate change. Increases in human numbers and per capita impacts underlie all of these. Against a background review of these factors, I conclude with a discussion of the policy implications for equitably proportionate actions-and of the difficulties in achieving them.
Figures
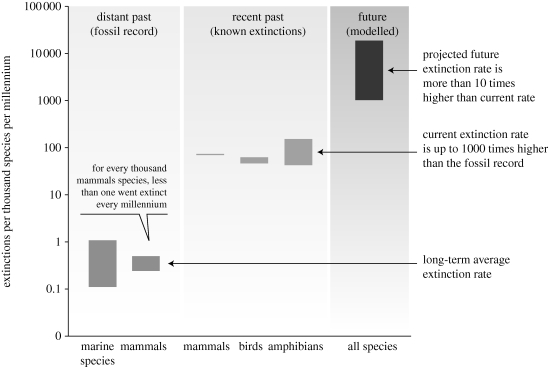
Species' extinction rates, expressed as extinctions per thousand species per millennium. ‘Distant past’ refers to average extinction rates as estimated from the fossil record; ‘recent past’ refers mainly to the past century and ‘future’ estimates are based on a variety of techniques (species–area models; rates at which species are shifting to increasingly more threatened categories and others) and pertain mainly to the next few centuries. For details, see Millennium Ecosystem Assessment (2005).
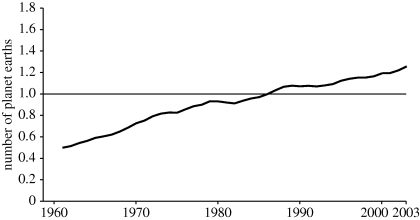
An estimate of the total EF of the human population, 1960–2001, as defined and discussed in the text. The straight line shows our planet's estimated biological capacity, that is the total EF available on a sustainable basis (after WWF 2008).
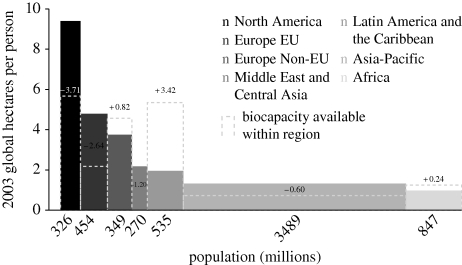
The average human EF in 2003 is shown, in units of area, for each of the planet's major geographical regions. The corresponding populations are shown on the x-axis, and the resulting rectangular areas represent the total ecological footprint by region. Adding all these together gives the total human ecological footprint, as shown in figure 2 (after, WWF 2008).
References
-
- Committee on Climate Change. Building a low-carbon economy. The UK Stationery Office (TSO); 2008. See www.tsoshop.co.uk .
-
- Conway G. R.2007A doubly Green Revolution: ecology and food production. In Theoretical ecology: principles and applications, pp. 158–171 Oxford University Press
-
- Constanza R., et al. 1997The value of the world's ecosystem services and natural capital. Nature 387, 253–257 (doi:10.1038/387253a0) - DOI
-
- Diamond J. M.1989The present, past and future of human-caused extinctions. Phil. Trans. R. Soc. Lond. B 325, 469–477 (doi:10.1098/rstb.1989.0100) - DOI - PubMed
-
- Diamond J. M.2005Collapse: how societies choose to fail or survive Allen Lab New York, NY: Viking Books
Publication types
MeSH terms
LinkOut - more resources
Full Text Sources
Miscellaneous