. 2010 Feb 1;588(Pt 3):447-63.
doi: 10.1113/jphysiol.2009.184317. Epub 2009 Dec 14.

NMDAR-mediated EPSCs are maintained and accelerate in time course during maturation of mouse and rat auditory brainstem in vitro

Affiliations

NMDAR-mediated EPSCs are maintained and accelerate in time course during maturation of mouse and rat auditory brainstem in vitro

Joern R Steinert et al. J Physiol. .

Abstract

NMDA receptors (NMDARs) mediate a slow EPSC at excitatory glutamatergic synapses throughout the brain. In many areas the magnitude of the NMDAR-mediated EPSC declines with development and is associated with changes in subunit composition, but the mature channel composition is often unknown. We have employed the calyx of Held terminal with its target, the principal neuron of the medial nucleus of the trapezoid body (MNTB), to examine the NMDAR-mediated EPSC during synapse maturation from P10 to P40. Our data show that the calyx has reached a mature state by around P18. The NMDAR-mediated EPSC amplitude (and dominant decay ) fell from around 5 nA (: 40-50 ms) at P10/11 to 0.3-0.5 nA (: 10-15 ms) by P18. The mature NMDAR-EPSC showed no sensitivity to ifenprodil, indicating lack of NR2B subunits, and no block by submicromolar concentrations of zinc, consistent with NR1-1b subunit expression. Additionally, from P11 to P18 there was a reduction in voltage-dependent block and the apparent dissociation constant for [Mg(2+)](o) (K(o)) changed from 7.5 to 14 mm. Quantitative PCR showed that the relative expression of NR2A and NR2C increased, while immunohistochemistry confirmed the presence of NR2A, NR2B and NR2C protein. Although the mature NMDAR-EPSC is small, it is well coupled to NO signalling, as indicated by DAR-4M imaging. We conclude that native mature NMDAR channels at the calyx of Held have a fast time course and reduced block by [Mg(2+)](o), consistent with dominance of NR2C subunits and functional exclusion of NR2B subunits. The pharmacology suggests a single channel type and we postulate that the mature NMDARs consist of heterotrimers of NR1-1b-NR2A-NR2C.


Figures
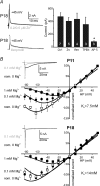
Figure 7
Figure 7. P18 NMDA-EPSCs are insensitive to [Zn2+]o and ifenprodil and show reduced sensitivity to block by [Mg2+]o
A, two example traces of NMDAR-EPSC recorded at +45 mV under control conditions and during perfusion of 0.5 μm Zn2+ (upper, grey trace) or ifenprodil (lower, grey trace). Bar graph summarises this pharmacology under the indicated conditions in P18 mice. The NMDAR-EPSC is insensitive to 0.2–0.5 μm Zn2+, ifenprodil (10 μm, Ifen) and the Zn2+ chelator TPEN (10 μm) but is blocked by d-AP-5 (50 μm). n= number of cells, indicated on the bars. B, voltage-dependent block by extracellular Mg2+ at P11 (upper I–V curve) and P18 (lower I–V curve). Both I–V curves show NMDAR-EPSCs with 1 mm[Mg2+]o (filled squares, averaged data from mouse and rat, n= 5), and for 0.1 mm (filled circles, mouse, n= 3) or nominally Mg2+ free (assuming 35 μm contaminating Mg2+, open squares, mouse, n= 4). Insets show appropriate example traces at a holding potential of −65 mV for the indicated [Mg2+]o. Continuous lines show data fits by eqn (1) with identical parameters at both ages, except for Ko. Vr= 6 mV, G= 5 μS (normalised), Vo= 15 mV; P11: Ko= 7.5 mm, P18: Ko= 14 mm. Data are means ±s.e.m. Significance was tested using ANOVA, *P < 0.05.
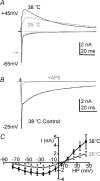
Figure 1
Figure 1. NMDAR-EPSCs double in amplitude on raising experimental temperature from RT to physiological
A, the evoked EPSC at holding potentials of −65 mV or +45 mV for 37°C (black traces) and 25°C (grey traces) recorded from the same MNTB neuron. Zero current is indicated by the dashed line. The grey arrow indicates the peak fast EPSC at 25°C. B, superimposed traces from the same cell at a holding potential of −25 mV, before and during perfusion with the specific NMDAR antagonist d-AP5 (50 μm, grey trace). C, average current–voltage relationship measured at the peak of the slow EPSC shows the classic voltage dependence block at negative potentials. The potentiation with raised temperature is similar across all voltages, suggesting that the increase is not due to a change in magnesium sensitivity of the NMDAR. Data are means ±s.e.m. from 3 neurons per data point, each measured at both temperatures, from rat calyx of Held/MNTB.
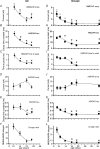
Figure 3
Figure 3. Development of fast-AMPAR and slow-NMDAR-EPSCs generated in response to stimulation of the calyx of Held of rat (left, A–F) and mouse (right, G–L)
A and G, NMDAR-EPSC amplitudes decay from P10/11 (rat) and P9 (mouse) until P18. NMDAR peak currents were measured at +45 mV. B and H, slow-EPSC decay time constants accelerate until P18–P21. C and I, the time to peak of the slow EPSC also accelerates until P21 (note that P35 values in mice were so fast that they showed no distinct peak). D and J, fast AMPAR-EPSC amplitudes (measured at −65 mV) increase from P14 to P18; however, the data from rat appear to show a decline again at P21. E and K, fast EPSC decay time constants accelerate. F and L, NMDAR-EPSC to AMPAR-EPSC charge ratios were calculated at positive (+45 mV) and negative voltages (−65 mV), respectively (see Methods). Significance was tested using ANOVA followed by a post hoc test, *Significance relative to youngest age. Data are means ±s.e.m. from 3–9 cells per data point (n= number of cells and is indicated above the data points in A and G). *Statistical significance was accepted if P < 0.05; data are from rat and mouse calyx of Held/MNTB neurons.
Figure 2
Figure 2. The NMDAR-EPSC shows declining amplitude and accelerating decay during maturation
Example EPSCs for +45 mV and −65 mV holding potentials are shown superimposed (left) for examples recorded from rat MNTB neurons at P14, P18 and P21. The mean I–V relationships (non-isochronal) for the NMDAR-EPSC are shown (right) for the same ages. Insets show example traces at positive holding potentials demonstrating block of the outward slow EPSC current by the NMDAR antagonist AP-5. Data are means ±s.e.m. from 3 neurons per data point from rat calyx of Held/MNTB recordings.
Figure 4
Figure 4. NMDAR-EPSCs are maintained at mature calices from P35 mice
A, superimposed EPSCs from animals aged P12 (grey) or P35 (black) illustrating the large decrease in NMDAR-EPSC amplitude and faster kinetics (+45 mV, top traces, −65 mV, bottom traces). B, the slow EPSC at P35 is blocked by perfusion of the NMDAR antagonist d-AP5 (grey trace, HP =+45 mV). C, summation of NMDAR-EPSCs is an important element of NMDAR activation under physiological conditions; zero current indicated by dashed line, grey areas indicate accumulation of the slow-EPSC/NMDAR currents for P11 (50 Hz), P18 (300 Hz) and P35 (300 Hz) (HP =+45 mV). Data are from mouse calyx of Held/MNTB.
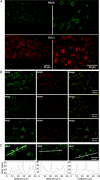
Figure 5
Figure 5. Immunohistochemical labelling indicates that NR2A, NR2B and NR2C are present in the MNTB
A, co-localisation of NR2A (green, top) and Kv3.1b (red, bottom); both left (20× magnification) and right (40× magnification) MNTBs are shown from the same section of a P21 rat. B, co-labelling with antibodies for NR2A (top, green), NR2B (middle, green) or NR2C (bottom, green) with PSD-95 immunostaining (red). On the right merged images. C, higher magnification images of NR2A, NR2B and NR2C immunostaining with line scans of intensity shown below each image. Data are from rat MNTB.
Figure 6
Figure 6. Changes in relative expression of NR2 mRNA using qPCR in MNTB during development
Total RNA was isolated from animals at P10, P21 and P35 and gene expression was estimated by qPCR. NR2A shows the largest relative increase by P21, with NR2C also showing significant increases later in development. Statistically different: *P < 0.05, **P < 0.01. Data are from rat MNTB.
Figure 8
Figure 8. Changes in NMDAR-EPSC kinetics are similar for both the dominant fast and the minor slow time constants
The mean fits to the slow EPSC decay time constants are plotted across P11 to P35 mice. A, τfast; the fast τ shows significant acceleration with maturation from P14 onwards (ANOVA, P < 0.05). There are no kinetic changes of the fast decaying current from P14. B, τslow; the slow τ does not show significant changes with age. C, the absolute amplitudes of the slow and fast components are plotted against age. Both components decline in amplitude but the ratio of fast : slow is unchanged as shown in D. Data are means ±s.e.m., n= number of cells indicated in bars, *Statistical significance, P < 0.05. Significance was tested using ANOVA; data are from mouse. All recordings were made with a holding potential of +45 mV for NMDAR currents.
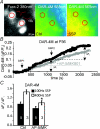
Figure 9
Figure 9. NO generation on synaptic stimulation in MNTB neurons from P36–P40 mice
A, 3 MNTB neurons (fluorescence at 380 nm, left) out of which 2 receive a synaptic input which generates postsynaptic Ca2+ increases (red traces) on synaptic stimulation. The two DAR-4M images show fluorescence before (Ctrl, middle) and after synaptic stimulation (SSP, right). B, DAR-4 m fluorescence is plotted over time for a control recording with two repeated SSPs (synaptic stimulation protocol [100 Hz trains for 500 ms repeated at 1 Hz for 60 s]) and a recording in which 50 μm AP-5 and 10 μm MK801 were applied prior to the second SSP leading to a reduced response to the second SSP. Repetition of a SSP shows the bi-phasic increase in DAR-4M fluorescence (ΔF1 and ΔF2 measured 1000 s after stimulation), and after incubation with NMDAR antagonists (50 μm AP-5, 10 μm MK801) the second phase (ΔF2) is reduced. C, ratios of ΔF2F1 for different stimulation frequencies (100 Hz and 400 Hz); following NMDAR antagonist incubation this ratio shows a stronger reduction. Data are means ±s.e.m., n= number of cells indicated in bars. Significance was tested using Student's t test, *P < 0.05 relative to Ctrl.

Similar articles

Cited by

References

    1. Aamodt SM, Constantine-Paton M. The role of neural activity in synaptic development and its implications for adult brain function. Adv Neurol. 1999;79:133–144. - PubMed
    1. Ascher P, Nowak L. The role of divalent cations in the N-methyl-d-aspartate responses of mouse central neurones in culture. J Physiol. 1988;399:247–266. - PMC - PubMed
    1. Barnes-Davies M, Forsythe ID. Pre- and postsynaptic glutamate receptors at a giant excitatory synapse in rat auditory brainstem slices. J Physiol. 1995;488:387–406. - PMC - PubMed
    1. Billups B, Wong AC, Forsythe ID. Detecting synaptic connections in the medial nucleus of the trapezoid body using calcium imaging. Pflugers Arch. 2002;444:663–669. - PubMed
    1. Birch PJ, Grossman CJ, Hayes AG. 6,7-Dinitro-quinoxaline-2,3-dion and 6-nitro,7-cyano-quinoxaline-2,3-dion antagonise responses to NMDA in the rat spinal cord via an action at the strychnine-insensitive glycine receptor. Eur J Pharmacol. 1988;156:177–180. - PubMed

Publication types

MeSH terms

Substances