

Estimating DNA coverage and abundance in metagenomes using a gamma approximation
- PMID: 20008478
- PMCID: PMC2815663
- DOI: 10.1093/bioinformatics/btp687
Estimating DNA coverage and abundance in metagenomes using a gamma approximation
Abstract
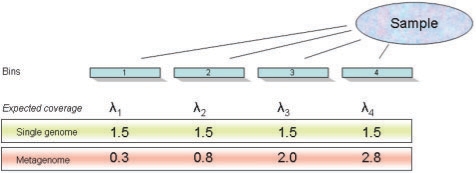
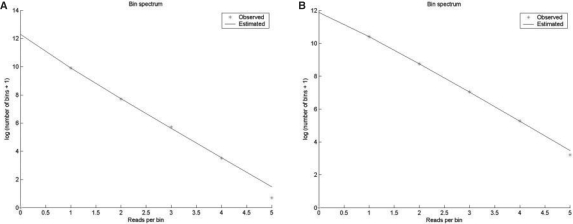
Motivation: Shotgun sequencing generates large numbers of short DNA reads from either an isolated organism or, in the case of metagenomics projects, from the aggregate genome of a microbial community. These reads are then assembled based on overlapping sequences into larger, contiguous sequences (contigs). The feasibility of assembly and the coverage achieved (reads per nucleotide or distinct sequence of nucleotides) depend on several factors: the number of reads sequenced, the read length and the relative abundances of their source genomes in the microbial community. A low coverage suggests that most of the genomic DNA in the sample has not been sequenced, but it is often difficult to estimate either the extent of the uncaptured diversity or the amount of additional sequencing that would be most efficacious. In this work, we regard a metagenome as a population of DNA fragments (bins), each of which may be covered by one or more reads. We employ a gamma distribution to model this bin population due to its flexibility and ease of use. When a gamma approximation can be found that adequately fits the data, we may estimate the number of bins that were not sequenced and that could potentially be revealed by additional sequencing. We evaluated the performance of this model using simulated metagenomes and demonstrate its applicability on three recent metagenomic datasets.
Supplementary information: Supplementary data are available at Bioinformatics online.
Figures
References
-
- Brass W. Simplified methods of fitting the truncated negative binomial distribution. Biometrika. 1958;45:9.
-
- Chao A. Nonparametric estimation of the number of classes in a population. Scand. J. Statist. 1984;11:5.
-
- Chao A, Bunge J. Estimating the number of species in a stochastic abundance model. Biometrics. 2002;58:531–539. - PubMed
Publication types
MeSH terms
Substances
LinkOut - more resources
Full Text Sources
Other Literature Sources
