. 2009 Dec 21;206(13):3115-30.
doi: 10.1084/jem.20091756. Epub 2009 Dec 14.

The origin and development of nonlymphoid tissue CD103+ DCs

Affiliations

The origin and development of nonlymphoid tissue CD103+ DCs

Florent Ginhoux et al. J Exp Med. .

Abstract

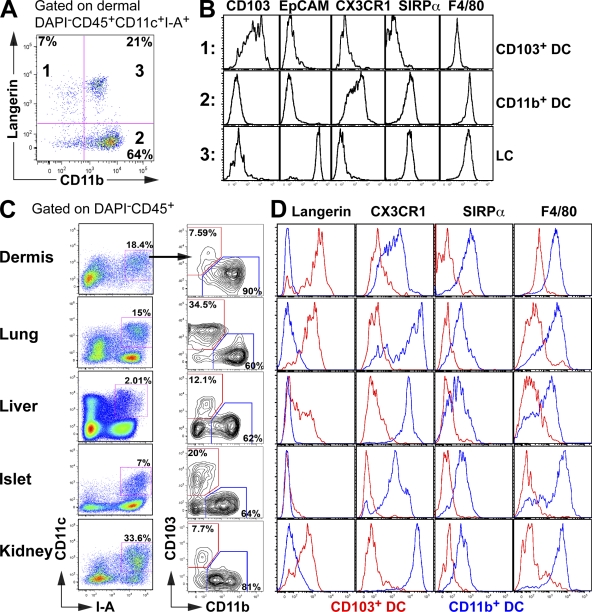
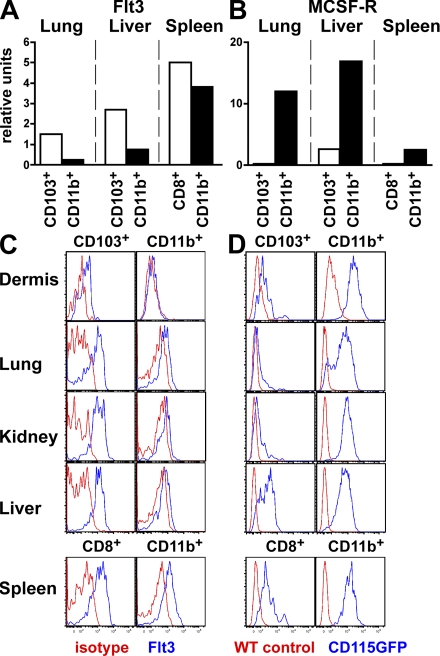
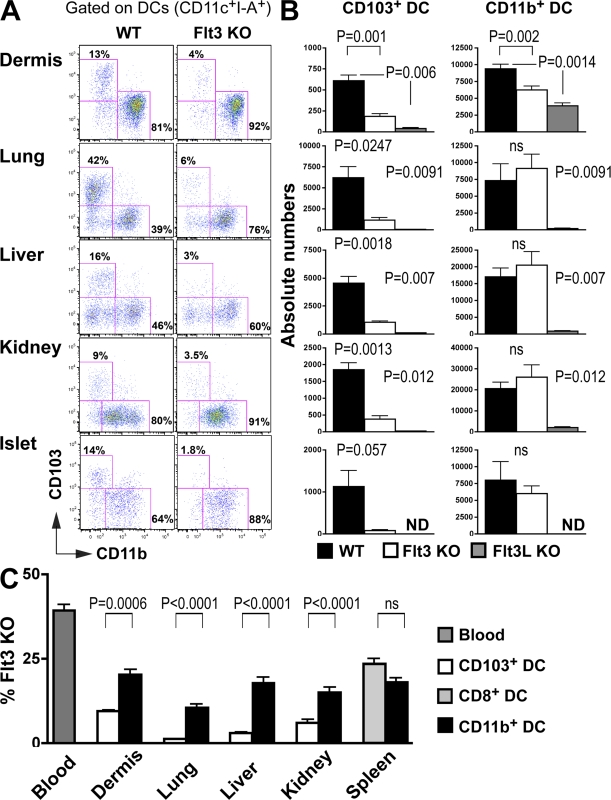
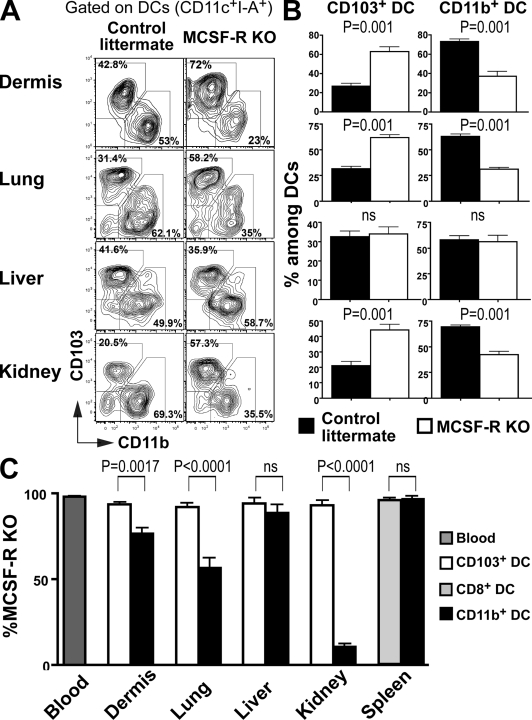
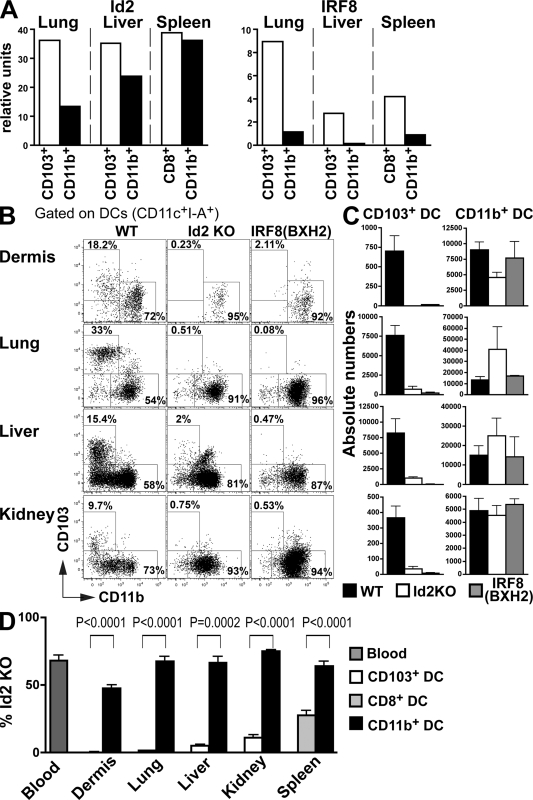
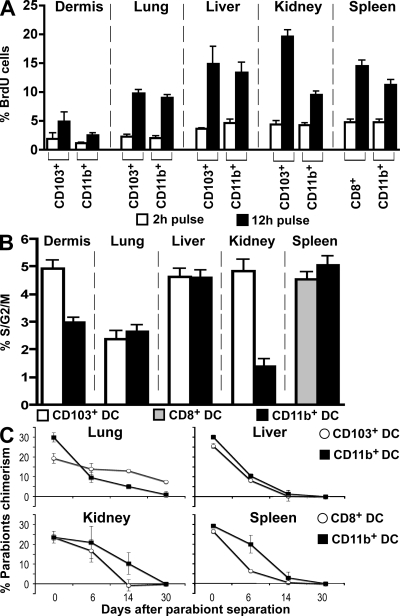
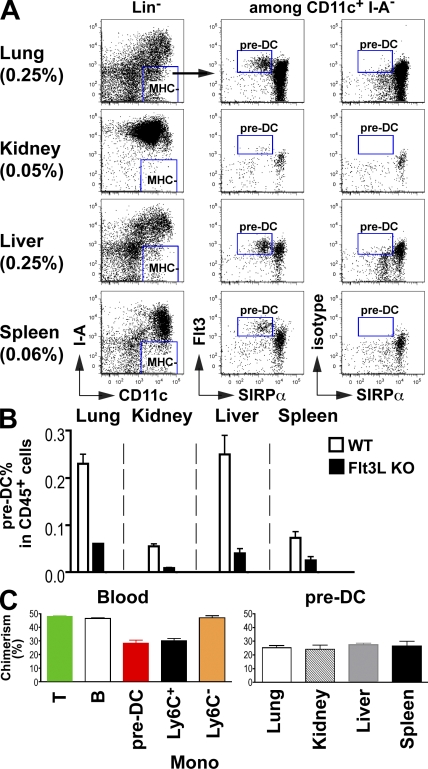
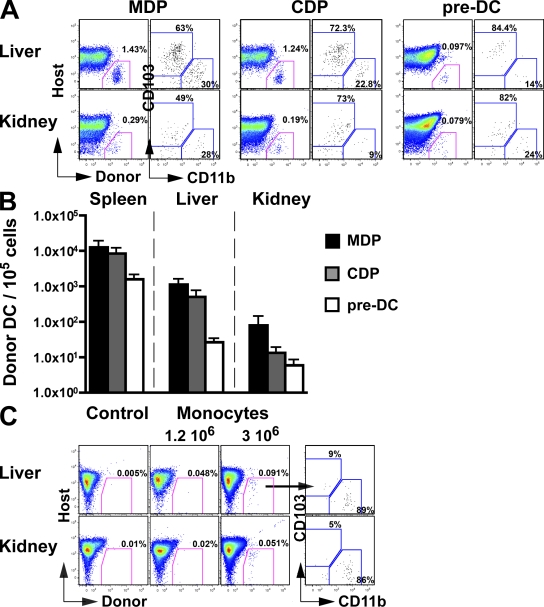
CD103(+) dendritic cells (DCs) in nonlymphoid tissues are specialized in the cross-presentation of cell-associated antigens. However, little is known about the mechanisms that regulate the development of these cells. We show that two populations of CD11c(+)MHCII(+) cells separated on the basis of CD103 and CD11b expression coexist in most nonlymphoid tissues with the exception of the lamina propria. CD103(+) DCs are related to lymphoid organ CD8(+) DCs in that they are derived exclusively from pre-DCs under the control of fms-like tyrosine kinase 3 (Flt3) ligand, inhibitor of DNA protein 2 (Id2), and IFN regulatory protein 8 (IRF8). In contrast, lamina propria CD103(+) DCs express CD11b and develop independently of Id2 and IRF8. The other population of CD11c(+)MHCII(+) cells in tissues, which is CD103(-)CD11b(+), is heterogenous and depends on both Flt3 and MCSF-R. Our results reveal that nonlymphoid tissue CD103(+) DCs and lymphoid organ CD8(+) DCs derive from the same precursor and follow a related differentiation program.


Figures

Figure 1.
Figure 1.
Two major phenotypically distinct DC subsets coexist in the dermis, lung, liver, pancreatic islets, and kidney. (A and B) Dermal cell suspensions isolated from langerin/EGFP, CX3CR1/EGFP, and WT C57BL/6 mice were analyzed by flow cytometry. (A) Dot plot shows the expression of langerin and CD11b on gated DAPICD45+CD11c+I-A+ dermal DCs, allowing the discrimination of three DC subsets. (B) Histograms show the expression levels of CD103, EpCAM, CX3CR1, SIRP-α, and F4/80 on the gated population described in A. (C and D) Dermal, lung, liver, pancreatic islets, and kidney cell suspensions were isolated from langerin/EGFP, CX3CR1/EGFP, and WT C57BL/6 mice. (C) Dot plot shows the expression of CD103 versus CD11b (right) on gated nonlymphoid tissue DAPICD45+CD11c+I-A+ DCs (left). For dermal DCs analysis, DCs were also gated on EPCAM to exclude LCs. (D) Histograms show overlays of cell surface marker expression on CD103+ (red) and CD11b+ (blue) DC subsets. These results are representative of three independent experiments (n = 2–3).
Figure 2.
Figure 2.
Cytokine receptor expression profile among CD103+ and CD11b+ tissue DC subsets. (A and B) DC subsets were sorted from the lung, liver, and spleen of C57BL/6 mice and RNA expression was measured by quantitative RT-PCR. Bar graphs present the relative expression of Flt3 (A) and MCSF-R (B) in lung and liver CD103+ (white) and CD11b+ (black) DCs and spleen CD8+ (white) and CD8CD11b+ (black) DCs. One representative experiment of three independent experiments is shown. (C and D) Dermal, lung, kidney, liver, and spleen cell suspensions were isolated from WT C57BL/6 and MCSF-R/EGFP mice and analyzed by flow cytometry. (C) Histograms show Flt3 cell surface expression (blue) or isotype antibody control (red) on gated CD103+ versus CD11b+ DC subsets in the dermis, lung, kidney, and liver and CD8+ versus CD8CD11b+ DCs in the spleen. (D) Histograms show MCSF-R/EGFP expression (blue) or WT C57BL/6 control (red) on gated DC subsets in the same tissue. These results are representative of three independent experiments.
Figure 3.
Figure 3.
The development of tissue CD103+ DCs is dependent on Flt3 and Flt3L. (A–C) Nonlymphoid tissue DCs isolated from WT, Flt3 KO (A and B), and Flt3L KO (C) C57BL/6 mice were analyzed by flow cytometry. (A) Dot plots show CD103 and CD11b expression among gated DAPICD45+CD11c+I-A+ DCs in WT (left) and Flt3 KO mice (right). (B) Bar graphs show the absolute numbers of CD103+ and CD11b+ DC subsets among tissue DCs in WT (black) versus Flt3 KO (white) versus Flt3L (gray) mice. Bars represent data from six pooled experiments (n = 3–4). Error bars represent the mean ± SEM (n = 3). (C) Lethally irradiated CD45.1+ recipient mice were reconstituted with 50% CD45.1+ WT and 50% CD45.2+ WT mixed BM or with 50% CD45.1+ WT and 50% CD45.2+ Flt3 KO mixed BM and analyzed 2–3 mo after. Bar graphs show the relative contribution of Flt3 KO CD45.2+CD103+ DCs (white) among total CD103+ DCs and the relative contribution of Flt3 KO CD45.2+CD11b+ DCs (black) among total CD11b+ DCs. Spleen CD8+ (light gray) and CD11b+ DC (black) subsets are also shown. Dark gray bars represent the relative number of Flt3 KO CD45.2+ blood granulocyte chimerism. Data shown represent two pooled experiments (n = 3). Error bars represent the means ± SEM. P-values indicate the results of a Student's t test performed between the indicated groups.
Figure 4.
Figure 4.
MCSF-R is required for normal development of some nonlymphoid tissue CD11b+ DCs. (A) Dot plots show CD103 and CD11b expression among tissue CD45+CD11c+I-A+ DCs in MCSF-R KO (right) or control littermate (left) mice. (B) Bar graphs show the relative numbers of CD103+ and CD11b+ DC subsets among tissue DCs in control littermates (black) versus MCSF-R KO mice (white). Bars represent data from three pooled experiments (n = 2–3). Error bars represent the mean ± SEM. (C) Lethally irradiated CD45.1+ recipient mice were reconstituted with 5% CD45.1+ WT and 95% CD45.2+ WT fetal liver or 5% CD45.1+ WT and 95% CD45.2+ MCSF-R KO fetal liver. Bar graphs show the relative contribution of MCSF-R KO CD45.2+CD103+ DCs (white) among total CD103+ DCs and the relative contribution of MCSF-R KO CD45.2+CD11b+ DCs (black) among total CD11b+ DCs. Spleen CD8+ (light gray) and CD11b+ DC (black) subsets are also shown. Dark gray bars represent the percentage of MCSF-R KO CD45.2+ blood granulocytes chimerism. Data shown represent three pooled experiments (n = 3). Error bars represent the means ± SEM. P-values indicate the results of a Student's t test performed between the indicated groups.
Figure 5.
Figure 5.
The development of CD103+ DCs in tissues is also dependent on Id2 and IRF8. (A) Lung and liver CD103+ and CD11b+ DC subsets and spleen CD8+ and CD8CD11b+ DCs were isolated from C57BL/6 mice and mRNA expression of Id2 and IRF8 was measured by quantitative RT-PCR. Bar graphs present the relative expression of Id2 (left) and IRF8 (right). One representative experiment of two independent experiments is shown. (B and C) Nonlymphoid tissue DCs isolated from WT, Id2 KO, and IRF8 (BXH2) C57BL/6 mice were analyzed by flow cytometry. (B) Dot plots show CD103 and CD11b expression among gated DAPICD45+CD11c+I-A+ DCs in WT (left), Id2 KO mice (middle), and IRF8 (BXH2; right). (C) Bar graphs show the absolute numbers of CD103+ and CD11b+ DC subsets among tissue DCs in WT (black), Id2 KO (white), and IRF8 (BXH2; gray) mice. Bars represent data from two pooled experiments (n = 2–3). Error bars represent the mean ± SEM. (D) Lethally irradiated CD45.1+ recipient mice were reconstituted with 50% CD45.1+ WT and 50% CD45.2+ WT mixed BM or with 50% CD45.1+ WT and 50% CD45.2+ Id2 KO mixed BM and analyzed 2–3 mo after. Bar graphs show the relative contribution of Id2 KO CD45.2+CD103+ DCs (white) among total CD103+ DCs and the relative contribution of Id2 KO CD45.2+CD11b+ DCs (black) among total CD11b+ DCs. Spleen CD8+ (light gray) and CD11b+ DC (black) subsets are also shown. Dark gray bars represent the percentage of Id2 KO CD45.2+ blood granulocytes chimerism. Data shown represent two pooled experiments (n = 3). Error bars represent means ± SEM. P-values indicate the results of a Student's t test performed between the indicated groups.
Figure 6.
Figure 6.
Turnover of nonlymphoid tissue DC subsets. (A and B) BrdU incorporation and proliferation index of tissue DC subsets were measured by flow cytometry. Dermal, lung, liver, kidney, and spleen cell suspensions were isolated from WT C57BL/6 mice. (A) Bar graphs show the relative numbers of BrdU+ cells among CD103+ and CD11b+ DC subsets in nonlymphoid tissues and among CD8+ and CD8CD11b+ spleen DCs after a 2-h (white) or a 12-h (black) BrdU pulse. Bars represent data from two pooled experiments (n = 3). Error bars represent the mean ± SEM. (B) Bar graph shows the percentage of proliferating cells (% S/G2/M) measured by DNA content among CD103+ (white) and CD11b+ (black) DC subsets in nonlymphoid tissues and among CD8+ (grey) and CD8CD11b+ (black) spleen DCs. Bars represent data from three pooled experiments (n = 3). Error bars represent the mean ± SEM. (C) Tissue DC mixing in parabiotic mice. CD45.2 and CD45.1 C57BL/6 mice were surgically joined for 55 d before being separated. Graphs show the percentage of parabiont-derived DCs among each DC subset in the lung, liver, kidney, and spleen at different times after parabiont separation. Bars represent two separate parabionts at each time point. Error bars represent the mean ± SEM.
Figure 7.
Figure 7.
Pre-DCs are present in nonlymphoid tissues. (A) Dot plots show the relative numbers of CD45+MHCII+CD11cFlt3hiSIRP-α pre-DCs among hematopoietic cells in the lung, kidney, liver, and spleen. (B) Bar graph shows the relative numbers of pre-DCs in indicated organs of Flt3L+/+ (WT, white) and Flt3L−/− (black) mice. One representative experiment of three (A) and two (B) independent experiments is shown (n = 2). (C) CD45.2 and CD45.1 C57BL/6 mice were surgically joined for 55 d. Graphs show the percentage of parabiont-derived T cells, B cells, and pre-DCs in the blood and the percentage of parabiont-derived pre-DCs in the lung, kidney, liver, and spleen 55 d after parabiosis was established. The bar graphs summarize two independent experiments with more than three mice in total. Error bars represent the mean ± SEM.
Figure 8.
Figure 8.
Tissue DCs arise from pre-DCs in vivo. (A and B) MDPs, CDPs, and pre-DCs were purified from the BM of CD45.1+ mice, as described in the Material and methods, and adoptively transferred into unconditioned CD45.2+ congenic host. (A) Dot plots show the percentage of CD45.1+ donor-derived DCs among total kidney and liver DAPICD11c+MHCII+ DCs in mice injected with MDP, CDP, and pre-DCs. Host corresponds to the endogenous (CD45.2+) DC population. (B) Bar graph shows the mean absolute numbers of CD45.1+ donor-derived MHCII+CD11c+ DCs normalized to a 105 cells input of MDPs (black), CDPs (gray), and pre-DCs (white). Bars represent data from four pooled experiments (n = 1–2). Error bars represent the means ± SEM. (C) Monocytes were purified from the BM of CD45.2+ mice, as described in the Material and methods, and adoptively transferred into unconditioned CD45.1+ congenic host. Dot plot show the percentage of donor CD45.2+ monocyte-derived DCs among total kidney and liver DAPICD11c+MHCII+ DCs in mice injected with 1.2 × 10⁶ or 3 × 10⁶ monocytes. Host corresponds to the endogenous (CD45.1+) DC population. Control represents noninjected mice.

Similar articles

Cited by

References

    1. Aliberti J., Schulz O., Pennington D.J., Tsujimura H., Reis e Sousa C., Ozato K., Sher A. 2003. Essential role for ICSBP in the in vivo development of murine CD8alpha + dendritic cells. Blood. 101:305–310 10.1182/blood-2002-04-1088 - DOI - PubMed
    1. Annacker O., Coombes J.L., Malmstrom V., Uhlig H.H., Bourne T., Johansson-Lindbom B., Agace W.W., Parker C.M., Powrie F. 2005. Essential role for CD103 in the T cell–mediated regulation of experimental colitis. J. Exp. Med. 202:1051–1061 10.1084/jem.20040662 - DOI - PMC - PubMed
    1. Austyn J.M., Gordon S. 1981. F4/80, a monoclonal antibody directed specifically against the mouse macrophage. Eur. J. Immunol. 11:805–815 10.1002/eji.1830111013 - DOI - PubMed
    1. Banchereau J., Briere F., Caux C., Davoust J., Lebecque S., Liu Y.J., Pulendran B., Palucka K. 2000. Immunobiology of dendritic cells. Annu. Rev. Immunol. 18:767–811 10.1146/annurev.immunol.18.1.767 - DOI - PubMed
    1. Bedoui S., Whitney P.G., Waithman J., Eidsmo L., Wakim L., Caminschi I., Allan R.S., Wojtasiak M., Shortman K., Carbone F.R., et al. 2009. Cross-presentation of viral and self antigens by skin-derived CD103+ dendritic cells. Nat. Immunol. 10:488–495 10.1038/ni.1724 - DOI - PubMed

Publication types

MeSH terms