. 2009 Dec 14;187(6):859-74.
doi: 10.1083/jcb.200903131.

Muscle inactivation of mTOR causes metabolic and dystrophin defects leading to severe myopathy

Affiliations

Muscle inactivation of mTOR causes metabolic and dystrophin defects leading to severe myopathy

Valérie Risson et al. J Cell Biol. .

Abstract

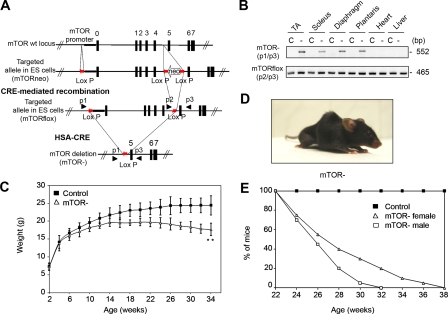
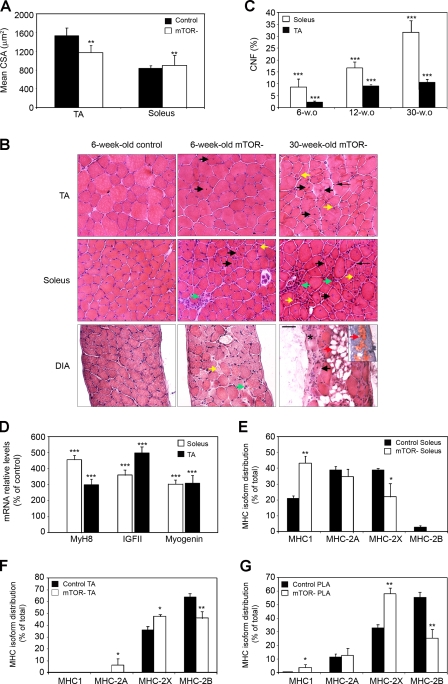
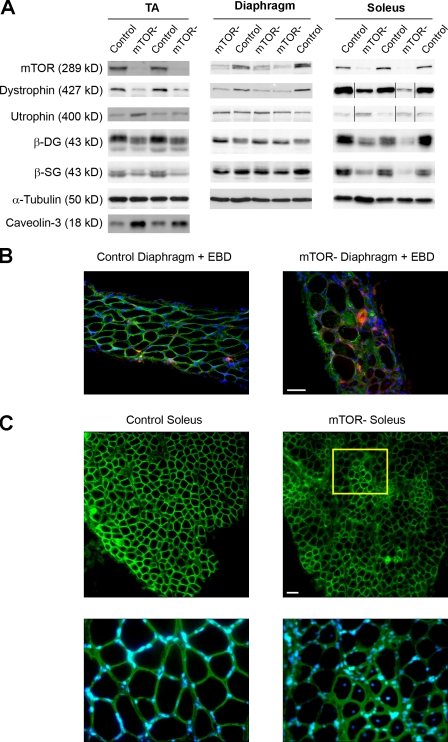
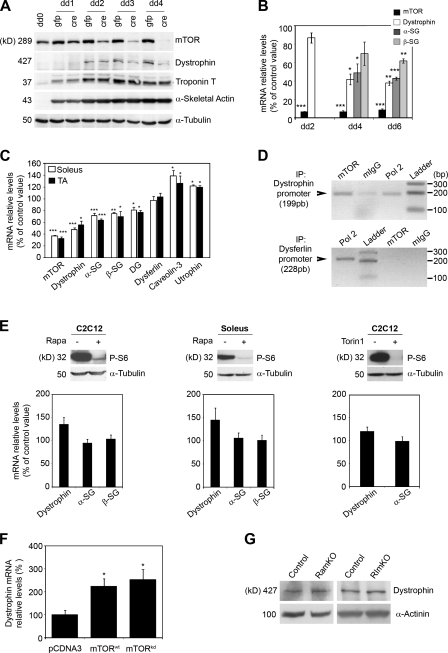
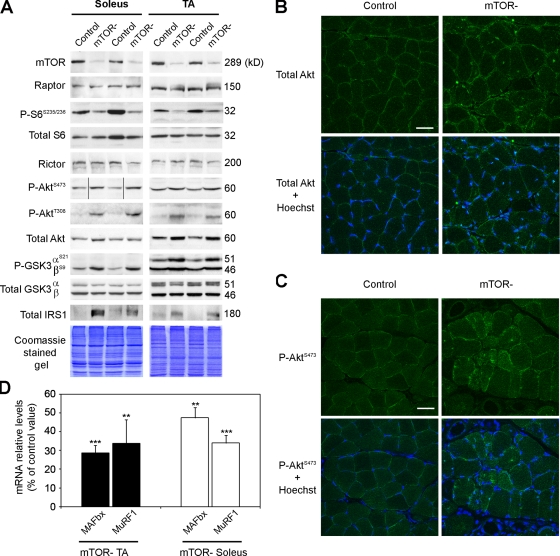
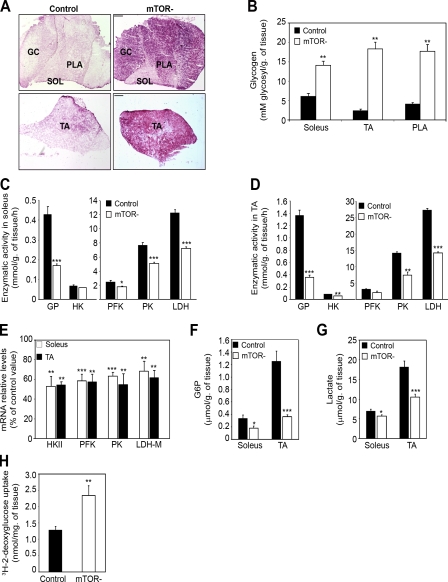
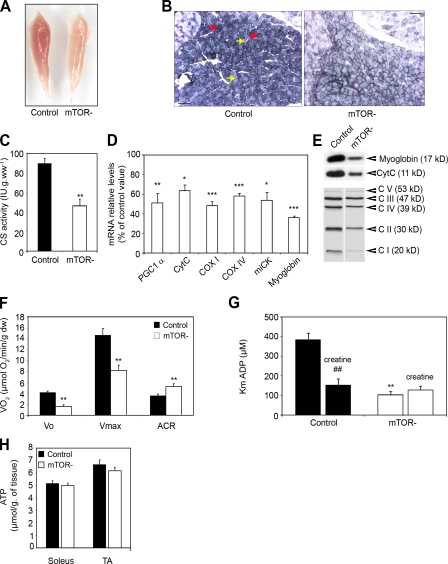
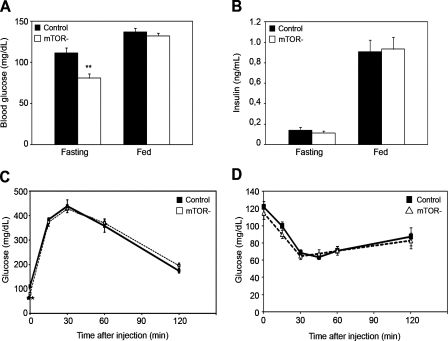
Mammalian target of rapamycin (mTOR) is a key regulator of cell growth that associates with raptor and rictor to form the mTOR complex 1 (mTORC1) and mTORC2, respectively. Raptor is required for oxidative muscle integrity, whereas rictor is dispensable. In this study, we show that muscle-specific inactivation of mTOR leads to severe myopathy, resulting in premature death. mTOR-deficient muscles display metabolic changes similar to those observed in muscles lacking raptor, including impaired oxidative metabolism, altered mitochondrial regulation, and glycogen accumulation associated with protein kinase B/Akt hyperactivation. In addition, mTOR-deficient muscles exhibit increased basal glucose uptake, whereas whole body glucose homeostasis is essentially maintained. Importantly, loss of mTOR exacerbates the myopathic features in both slow oxidative and fast glycolytic muscles. Moreover, mTOR but not raptor and rictor deficiency leads to reduced muscle dystrophin content. We provide evidence that mTOR controls dystrophin transcription in a cell-autonomous, rapamycin-resistant, and kinase-independent manner. Collectively, our results demonstrate that mTOR acts mainly via mTORC1, whereas regulation of dystrophin is raptor and rictor independent.


Figures

Figure 1.
Figure 1.
Muscle-specific inactivation of mTOR. (A) mTORflox and mTOR mice were generated as described in Materials and methods. (B) PCR analysis of Cre-mediated recombination of the mTORflox allele (p2/p3) showing that the deleted mTOR allele (p1/p3) was exclusively detected in skeletal muscles of mTOR mice. C, control; −, mTOR. (C) Growth curves of mTOR and control female mice (n = 15 mice). (D) Morphology of 22-wk-old female mTOR mice. (E) Survival curve of mTOR and control mice (n = 20). **, P < 0.01. Data indicate mean ± SD.
Figure 2.
Figure 2.
mTOR mice develop a progressive MD. (A) Analysis of the mean fiber CSA in TA and soleus muscles from 6-wk-old mice (n = 4). (B) H&E-stained transverse sections of TA, soleus, and diaphragm (DIA) muscles from control and mTOR mice. Degeneration with phagocytosis and mononuclear cell infiltration (green arrows), variation in fiber size with small atrophic fibers (yellow arrows), interfiber connective tissue (thin arrows), regenerated muscle fibers with centrally located nuclei (black arrows), fibrosis (asterisk), and fatty infiltration (red arrows) are shown. Adipogenic differentiation was confirmed by oil red O staining as shown in the inset. Bar, 50 µm. (C) Percentage of centrally nucleated fibers (CNF) increases with age in mTOR muscles. (D) Relative mRNA levels of MyH8, IGF-II, and myogenin in mTOR muscles from 6-wk-old mice. (E–G) Graphs show the percentage distribution of MHC isoforms I, 2B, 2X, and 2A in soleus (E), TA (F), and PLA (G) muscles from 6-wk-old control and mTOR mice. (C–G) n = 5 sample sets. *, P < 0.05; **, P < 0.01; ***, P < 0.001. Data indicate mean ± SEM.
Figure 3.
Figure 3.
Reduced DGC amount and utrophin induction in mTOR muscles. (A) Soleus, diaphragm, and TA muscle extracts from 6-wk-old mice were immunoblotted with the indicated antibodies to examine dystrophy-related protein levels. Black lines indicate that intervening lanes have been spliced out. (B) Rare Evans blue–positive fibers can be detected in mTOR diaphragms from 30-wk-old mice. (C) Dystrophin immunostaining (green) and Hoechst staining (blue) on soleus muscle sections from 11-wk-old control and mTOR mice showing sarcolemmal localization of residual dystrophin. A higher magnification view (inset) shows that dystrophin expression is reduced in noncentronucleated fibers, whereas it is normal in regenerating centronucleated fibers. Bars, 50 µm.
Figure 4.
Figure 4.
mTOR controls dystrophin expression. (A) Time course for mTOR inactivation, dystrophin down-regulation, and induction of terminal differentiation markers in cultured mTORflox myotubes. The myotubes were transduced by CMV-GFP or CMV-Cre adenovirus on differentiation day 1 (dd1), harvested at a different time point after differentiation, and immunoblotted with the indicated antibodies. (B) Relative mRNA levels of mTOR and the indicated DGC components in mTORflox myotubes transduced by Ad-Cre (n = 3). (C) Relative mRNA levels of mTOR and the indicated dystrophy-related genes in muscles from 6-wk-old mice (n = 5). (D) Detection of mTOR on the dystrophin promoter by ChIP assay. Antibodies against mTOR (lane 1), normal mouse IgG (lane 2), or RNA polymerase 2 (lane 3) were used to immunoprecipitate (IP) a mouse TA chromatin extract. The precipitated DNA was analyzed by PCR using primers for the dystrophin (top) or dysferlin (bottom) promoter. (E, top) Western blot analysis showing the phosphorylation status of S6 protein in C2C12 myotubes in the absence (−) or presence (+) of 20 nM rapamycin or 250 nM Torin1 for 48 h from differentiation day 4. For soleus muscle, C57BL/6 mice were daily injected intraperitoneally with 2.5 mg/kg rapamycin or vehicle for 8 d. (bottom) mRNA levels for the indicated DGC components in C2C12 myotubes and soleus muscle in absence or presence of the indicated mTOR inhibitors. (F) Relative mRNA levels of dystrophin in the TA muscle fibers of mTOR mice 12 d after in vivo coelectroporation of rat wild-type (wt) or kinase-dead (kd) mTOR and pRNAT-GFP vector. Graphs show means versus pcDNA3-electroporated control (n = 5 mice/group). (G) Western blot analysis showing dystrophin protein levels in soleus muscle from 14-wk-old RAmKO and RImKO mice. *, P < 0.05; **, P < 0.01; ***, P < 0.001. Data indicate mean ± SEM.
Figure 5.
Figure 5.
Signal transduction in mTOR muscles. (A) Muscle extracts from 6-wk-old mice were immunoblotted with the indicated antibodies to examine mTORC1 and mTORC2 signaling in soleus and TA muscles. Black lines indicate that intervening lanes have been spliced out. (B and C) Immunofluorescence staining for total PKB/Akt (B) and P-PKB/Akt (C; green) and Hoechst staining (blue) on control and mTOR soleus muscle sections. Bars, 50 µm. (D) Relative mRNA levels of MuRF1 and MAFbx in mTOR soleus and TA muscles. **, P < 0.01; ***, P < 0.001. Data indicate means versus control ± SEM (n = 5 sample sets).
Figure 6.
Figure 6.
Altered glucose usage and glycogen accumulation in mTOR muscle. (A) Representative periodic acid Schiff staining of soleus (SOL), PLA, GC, and TA muscle sections from 6-wk-old mice showing glycogen accumulation in mTOR muscles. Bar, 400 µm. (B) Quantification of muscle glycogen content (n = 5 sample sets). (C and D) GP and glycolytic enzyme activity in soleus (C) and TA (D) muscles (control, n = 5; mTOR, n = 4). (E) Relative mRNA levels of the indicated glycolytic enzymes in mTOR muscles (n = 5 sample sets). (F) Quantification of intramuscular glucose-6-phosphate (G6P) in control and mTOR mice. (G) Quantification of intramuscular lactate in control and mTOR mice. (H) Enhanced basal glucose uptake in isolated soleus muscle from 5-wk-old control and mTOR mice (n = 5–6 mice). (F and G) n = 8 sample sets. HK, hexokinase. *, P < 0.05; **, P < 0.01; ***, P < 0.001. Data indicate mean ± SEM.
Figure 7.
Figure 7.
Impaired oxidative metabolism in mTOR soleus muscle. (A) mTOR soleus muscle is paler than control muscle. (B) Succinate dehydrogenase histochemical staining demonstrating alterations of oxidative metabolism in mTOR soleus muscle from 6-wk-old mice. Oxidative and glycolytic fibers are indicated by red and yellow arrows, respectively. Bar, 100 µm. (C) Decreased citrate synthase (CS) activity in mTOR soleus muscle (n = 5 sample sets). (D) Relative mRNA levels of genes involved in oxidative energy production in mTOR soleus muscle (n = 5 sample sets). (E) Western blot analysis showing reduced protein levels for myoglobin, cytochrome c (cytc), and respiratory chain components (CI–CV) in mTOR soleus muscle. Equal protein loading was controlled by measuring total protein content and Coomassie blue staining. (F) Effect of mTOR depletion on mitochondrial respiration in saponin-skinned fibers from soleus muscles from 6-wk-old mice with glutamate and malate as substrates. The following data were measured: basal rate of mitochondrial oxygen consumption in the absence of ADP (Vo), maximal rate of oxygen consumption in the presence of 2 mM ADP (Vmax), and acceptor control ratio (ACR; control, n = 15; mTOR, n = 8). (G) Effect of mTOR depletion on mitochondria sensitivity for ADP in saponin-skinned fibers from soleus muscles. The apparent Km for ADP was measured in the absence and presence of 20 mM creatine (control, n = 8; mTOR, n = 5). (H) Intramuscular ATP levels in muscles from control and mTOR mice (n = 8 sample sets). ##, P < 0.01 (for control with creatine versus control without creatine); **, P < 0.01 (for mTOR without creatine versus control without creatine). Data indicate mean ± SEM.
Figure 8.
Figure 8.
Glucose homeostasis and insulin sensitivity in mTOR mice. (A) Fasting and fed blood glucose concentrations in mTOR and control male mice. (B) Fasting and fed serum insulin concentrations in mTOR and control male mice (n = 7 mice/group). (C) Glucose tolerance test on male mice (n = 15 mice/group). (D) Insulin tolerance test on mTOR and control mice (n = 8 mice/group). **, P < 0.01. Data indicate mean ± SEM.

Similar articles

Cited by

References

    1. Acharyya S., Butchbach M.E., Sahenk Z., Wang H., Saji M., Carathers M., Ringel M.D., Skipworth R.J., Fearon K.C., Hollingsworth M.A., et al. 2005. Dystrophin glycoprotein complex dysfunction: a regulatory link between muscular dystrophy and cancer cachexia. Cancer Cell. 8:421–432 10.1016/j.ccr.2005.10.004 - DOI - PubMed
    1. Agbulut O., Vignaud A., Hourde C., Mouisel E., Fougerousse F., Butler-Browne G.S., Ferry A. 2009. Slow myosin heavy chain expression in the absence of muscle activity. Am. J. Physiol. Cell Physiol. 296:C205–C214 10.1152/ajpcell.00408.2008 - DOI - PubMed
    1. Barton-Davis E.R., Cordier L., Shoturma D.I., Leland S.E., Sweeney H.L. 1999. Aminoglycoside antibiotics restore dystrophin function to skeletal muscles of mdx mice. J. Clin. Invest. 104:375–381 10.1172/JCI7866 - DOI - PMC - PubMed
    1. Bassel-Duby R., Olson E.N. 2006. Signaling pathways in skeletal muscle remodeling. Annu. Rev. Biochem. 75:19–37 10.1146/annurev.biochem.75.103004.142622 - DOI - PubMed
    1. Bayascas J.R., Alessi D.R. 2005. Regulation of Akt/PKB Ser473 phosphorylation. Mol. Cell. 18:143–145 10.1016/j.molcel.2005.03.020 - DOI - PubMed

Publication types

MeSH terms