. 2010 Mar;184(3):799-812.
doi: 10.1534/genetics.109.110304. Epub 2009 Dec 14.

Genetic control of photoperiod sensitivity in maize revealed by joint multiple population analysis

Affiliations

Genetic control of photoperiod sensitivity in maize revealed by joint multiple population analysis

Nathan D Coles et al. Genetics. 2010 Mar.

Abstract

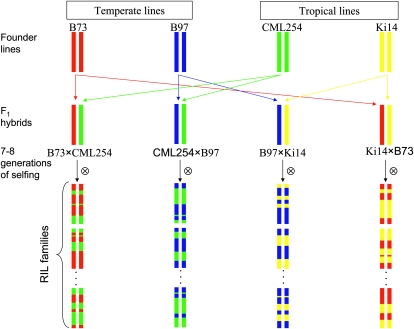
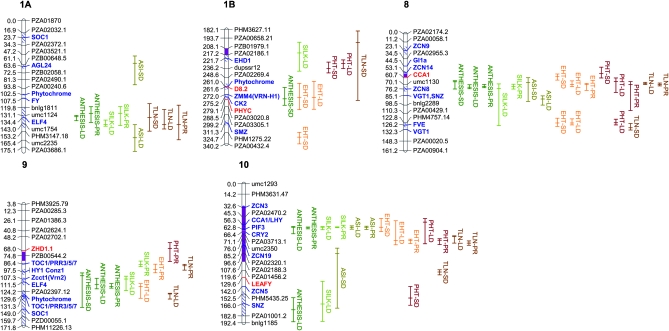
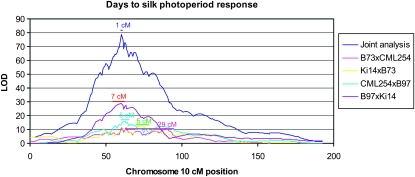
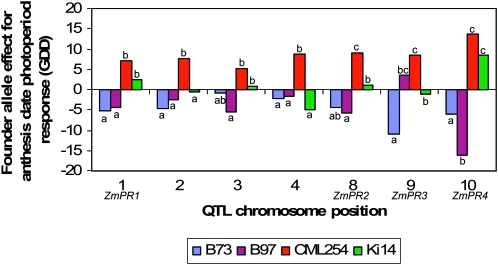
Variation in maize for response to photoperiod is related to geographical adaptation in the species. Maize possesses homologs of many genes identified as regulators of flowering time in other species, but their relation to the natural variation for photoperiod response in maize is unknown. Candidate gene sequences were mapped in four populations created by crossing two temperate inbred lines to two photoperiod-sensitive tropical inbreds. Whole-genome scans were conducted by high-density genotyping of the populations, which were phenotyped over 3 years in both short- and long-day environments. Joint multiple population analysis identified genomic regions controlling photoperiod responses in flowering time, plant height, and total leaf number. Four key genome regions controlling photoperiod response across populations were identified, referred to as ZmPR1-4. Functional allelic differences within these regions among phenotypically similar founders suggest distinct evolutionary trajectories for photoperiod adaptation in maize. These regions encompass candidate genes CCA/LHY, CONZ1, CRY2, ELF4, GHD7, VGT1, HY1/SE5, TOC1/PRR7/PPD-1, PIF3, ZCN8, and ZCN19.


Figures

F<sc>igure</sc> 1.—
Figure 1.—
Factorial mating of two temperate (B73 and B97) and two tropical (CML254 and Ki14) inbred maize lines to create four related recombinant inbred line mapping populations.
F<sc>igure</sc> 2.—
Figure 2.—
Linkage map of chromosomes 1, 8, 9, and 10 containing the four key photoperiod response QTL regions ZmPR1ZmPR4 based on the combined analysis of four RIL mapping populations. For the sake of clarity, chromosome 1 is displayed in two parts and only a subset of marker loci spaced about every 10 cM or more is shown. The complete genetic map with all QTL positions is shown in Figure S3. Candidate genes directly mapped are indicated in red. Map intervals containing candidate genes localized by inference indicated as segments with blue diagonal filling, with the candidate gene name in blue positioned at interval midpoint. Map intervals exhibiting significant segregation distortion in the combined analysis indicated as magenta segments on the linkage group. The map interval on chromosome 10 identified as having undergone a selection sweep by Tian et al. (2009) is indicated by a pink segment on the linkage group. QTL bars represent the 2-LOD support interval of the QTL position; the middle hash mark of a bar represents the maximum likelihood position of the QTL. Trait names for QTL are abbreviated as ANTHESIS for GDDTA, SILK for GDDTS, ASI for GDDASI, EHT for ear height, and PHT for plant height. SD, LD, and PR refer to QTL identified under short-day length or long-day length environments, or for photoperiod response, respectively.
F<sc>igure</sc> 3.—
Figure 3.—
Plots of LOD scores for the presence of a QTL affecting photoperiod response for days to silk along chromosome 10 of maize. Five separate analyses are plotted: the joint analysis (connected model) of four populations simultaneously and four individual population analyses (B73 × CML254, Ki14 × B73, CML254 × B97, and B97 × Ki14). Two-LOD support intervals around the peak QTL position are drawn with horizontal bars, with the length of the support interval presented above the bar.
F<sc>igure</sc> 4.—
Figure 4.—
Variation for functional allele effects at seven QTL detected for photoperiod response for anthesis date. At each QTL, four founder allele effects were estimated from the joint population analysis. Allele effects are estimated relative to recombinant inbred line population means: negative effects reduce the photoperiod response and positive effects increase the photoperiod response. Allelic effects within a QTL labeled with the same letter are not significantly different at P = 0.05.

Similar articles

Cited by

References

    1. Abler, B. S. B., M. D. Edwards and C. W. Stuber, 1991. Isoenzymatic identification of quantitative trait loci in crosses of elite maize inbreds. Crop Sci. 31 267–274.
    1. Allison, J. C. S., and T.B Daynard, 1979. Effect of change in time of flowering, induced by altering photoperiod or temperature, on attributes related to yield in maize. Crop Sci. 19 1–4.
    1. Beavis, W. D., O. S. Smith, D. Grant and R. Fincher, 1994. Identification of quantitative trait loci using a small sample of topcrossed and F4 progeny from maize. Crop Sci. 34 882–896.
    1. Beavis, W. D., 1998. QTL analyses: power, precision, and accuracy, pp. 145–162 in Molecular Dissection of Complex Traits, edited by A. H. Paterson. CRC Press, New York.
    1. Blanc, G., A. Charcosset, B. Mangin, A. Gallais and L. Moreau, 2006. Connected populations for detecting quantitative trait loci and testing for epistasis: an application in maize. Theor. Appl. Genet. 113 206–224. - PubMed

Publication types