Comparative Study
. 2010 Mar;184(3):853-63.
doi: 10.1534/genetics.109.110270. Epub 2009 Dec 14.

New tools for investigating the comparative biology of Caenorhabditis briggsae and C. elegans

Affiliations
Comparative Study

New tools for investigating the comparative biology of Caenorhabditis briggsae and C. elegans

Zhongying Zhao et al. Genetics. 2010 Mar.

Abstract

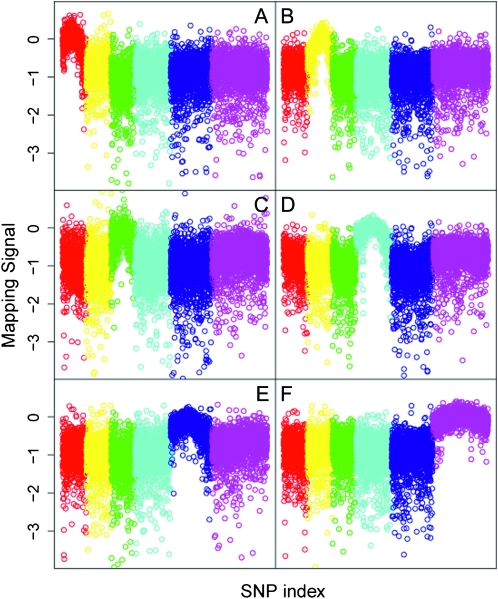
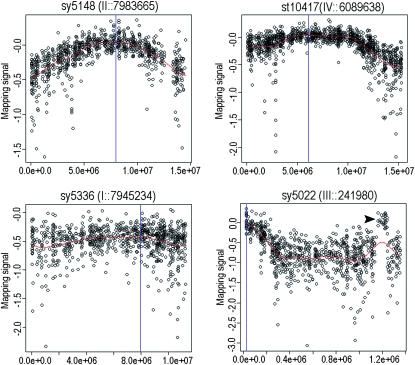
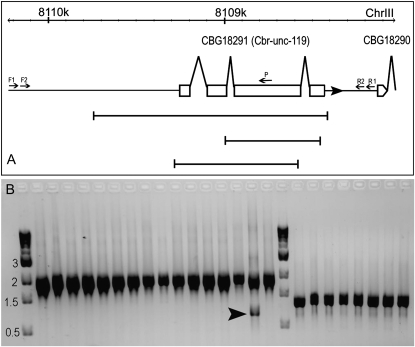
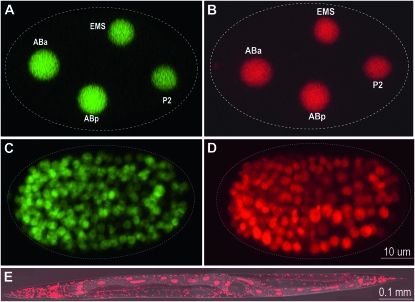
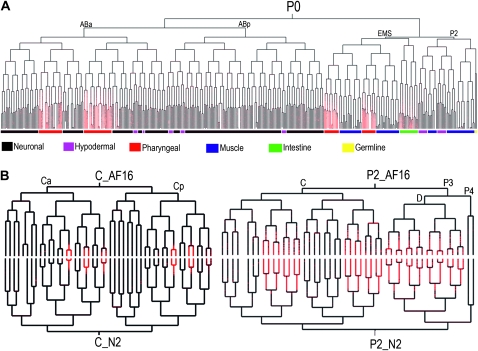
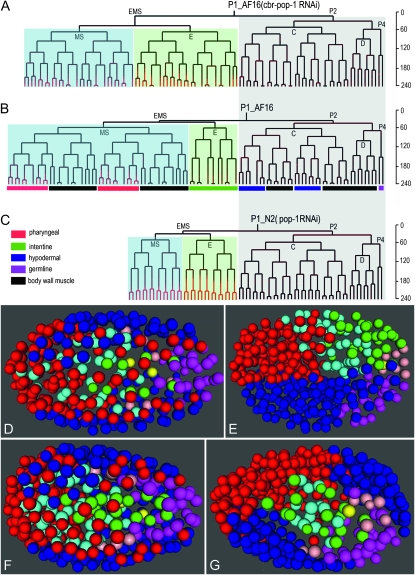
Comparative studies of Caenorhabditis briggsae and C. elegans have provided insights into gene function and developmental control in both organisms. C. elegans is a well developed model organism with a variety of molecular and genetic tools to study gene functions. In contrast, there are only very limited tools available for its closest relative, C. briggsae. To take advantage of the full potential of this comparative approach, we have developed several genetic and molecular tools to facilitate functional analysis in C. briggsae. First, we designed and implemented an SNP-based oligonucleotide microarray for rapid mapping of genetic mutants in C. briggsae. Second, we generated a mutagenized frozen library to permit the isolation of targeted deletions and used the library to recover a deletion mutant of cbr-unc-119 for use as a transgenic marker. Third, we used the cbr-unc-119 mutant in ballistic transformation and generated fluorescently labeled strains that allow automated lineaging and cellular resolution expression analysis. Finally, we demonstrated the potential of automated lineaging by profiling expression of egl-5, hlh-1, and pha-4 at cellular resolution and by detailed phenotyping of the perturbations on the Wnt signaling pathway. These additions to the experimental toolkit for C. briggsae should greatly increase its utility in comparative studies with C. elegans. With the emerging sequence of nematode species more closely related to C. briggsae, these tools may open novel avenues of experimentation in C. briggsae itself.


Figures

F<sc>igure</sc> 1.—
Figure 1.—
Genomic views of the mapping signals for six C. briggsae mutations. For each SNP represented on the array the differences between the median log2 ratio (mapping signal) for probes with AF16 and HK104 sequences are plotted against the SNP index distributed along the six chromosomes and differentially color coded from left to right for I, II, III, IV, V, and X, respectively. The alleles used are listed as follows: (A) I, sy5440; (B) II, sy5148; (C) III, sy5142; (D) IV, st10417; (E) V, sy5094; and (F) X, sy5001.
F<sc>igure</sc> 2.—
Figure 2.—
Linkage maximum estimation using spline fitting. Shown are the mapping signals plotted against the chromosome coordinates for four mutations located on four different chromosomes. The linkage maxima estimated by a cubic spline algorithm are indicated by blue lines. The chromosomal coordinates corresponding to the maxima are shown on the top of each panel along with allele names. Note a spike on the right arm of chromosome III (indicated by an arrowhead), which is likely caused by an error in the genome assembly.
F<sc>igure</sc> 3.—
Figure 3.—
Deletion alleles detected for cbr-unc-119. (A) Schematic representation of a cbr-unc-119 gene model (exons depicted as boxes and transcription orientation indicated by a solid arrowhead). Three deletion alleles are shown below the gene model at the same scale. The primers used for the nested PCR screening are indicated as small arrows. The chromosomal position in kilobases is listed above the gene model. (B) A gel picture for the two rounds of PCR products with the second round on the left (∼1.9 kb) and the (partial) first round on the right (∼1.4 kb in the presence of poisoning primer). A 1-kb ladder was loaded both on the leftmost lane and in between the two rounds of PCR products with the sizes indicated in kilobases. An arrowhead indicates a shifted deletion band.
F<sc>igure</sc> 4.—
Figure 4.—
Micrographs of transgene expression in C. briggsae lineaging strains. (A and C) Expression of histone GFP fusion in a four-cell embryo (A) and a bean stage embryo (C). (B and D) Expression of histone mCherry fusion in a four-cell embryo (B) and a bean stage embryo (D). The embryo boundary is indicated with dashed lines. (E) Expression of the same histone mCherry fusion in an adult C. briggsae animal merged with a DIC image. All the embryos and the adult animal are oriented so that anterior is to the left.
F<sc>igure</sc> 5.—
Figure 5.—
Automatic gene expression profiling at single-cell resolution in C. briggsae. (A) An embryonic lineage tree showing the expression profile of pha-4 (red branches) in a 350-cell C. briggsae embryo. The major tissue fates are color coded at the bottom. PHA-4∷GFP is present at higher levels in the precursors of pharynx than in those of intestine. Also labeled are the major founder cells. (B) Pairwise comparisons of the expression profile of a Hox gene, egl-5 (left) and a MyoD homolog, hlh-1 (right) between C. briggsae and C. elegans. Both spatial and temporal patterns of the expressing cells are well preserved for EGL-5 between the two species but expression of HLH-1 in C. briggsae appears delayed and intensity decreased as opposed to those in C. elegans despite the well preserved spatial patterns between the two species. All of the DNA constructs used here are protein fusions in C. elegans fosmids with GFP at the C-terminal ends. These were bombarded into both species to generate stable reporter-expressing strains (see materials and methods).
F<sc>igure</sc> 6.—
Figure 6.—
Comparison of cell lineages (A–C) and migrations (D–G) after RNAi against a Wnt signaling pathway component, POP-1 in both C. elegans and C. briggsae. The lineage trees are aligned with the P2 lineage with the P2-derived lineages shaded as light gray, the MS-derived lineages as light blue, and the E-derived lineages as light green. A homeotic lineage transformation from E to MS is observed in C. briggsae (A) while a transformation from MS to E is observed in C. elegans (C) as judged by cell division patterns. Note that the transformation from MSxp to MSxa is also likely in C. briggsae as evidenced by the ectopic expression of PHA-4 (red tree branches). The major tissue types are color coded in the wild-type P1 lineage (B). The developmental time in minutes at room temperature is shown on the right normalized to Sulston's time (Sulston et al. 1983). Differences in cell migrations after the RNAi against pop-1 are shown in a color-coded space-filling model. Note the similarity in cell positions of the wild-type embryos between C. briggsae (D) and C. elegans (F) but the differences in position for the progeny of ABp (dark blue), E (green), and MS (light blue) progeny between the pop-1-treated embryos of C. briggsae (E) and C. elegans (G). In particular, both MS and E cells remain on the surface of the pop-1 RNAi C. briggsae embryo (E) whereas the MS and E cells have taken up central, interior positions in the pop-1 RNAi-treated C. elegans embryo (G). The color keys for the models are red (ABa), dark blue (ABp), light blue (MS), green (E), magenta (C), light red (D), and yellow (P4).

References

    1. Ahringer, J., ed. Reverse Genetics (April 6, 2006), WormBook, ed. The C. elegans Research Community, WormBook, doi/10.1895/wormbook. 1.47.1, http://www.wormbook.org.
    1. Andolfatto, P., 2005. Adaptive evolution of non-coding DNA in Drosophila. Nature 437 1149–1152. - PubMed
    1. Bao, Z., J. I. Murray, T. Boyle, S. L. Ooi, M. J. Sandel et al., 2006. Automated cell lineage tracing in Caenorhabditis elegans. Proc. Natl. Acad. Sci. USA 103 2707–2712. - PMC - PubMed
    1. Brenner, S., 1974. The genetics of Caenorhabditis elegans. Genetics 77 71–94. - PMC - PubMed
    1. Chen, L., M. Krause, M. Sepanski and A. Fire, 1994. The Caenorhabditis elegans MYOD homologue HLH-1 is essential for proper muscle function and complete morphogenesis. Development 120 1631–1641. - PubMed

Publication types

MeSH terms