. 2010 Mar;184(3):731-44.
doi: 10.1534/genetics.109.109967. Epub 2009 Dec 14.

The chromatin-remodeling protein Osa interacts with CyclinE in Drosophila eye imaginal discs

Affiliations

The chromatin-remodeling protein Osa interacts with CyclinE in Drosophila eye imaginal discs

Jawaid Baig et al. Genetics. 2010 Mar.

Abstract

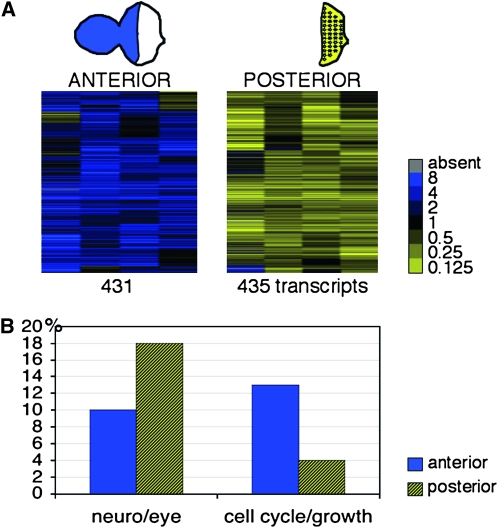
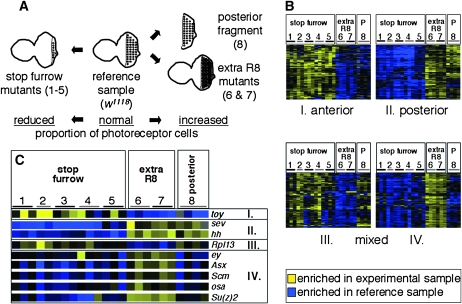
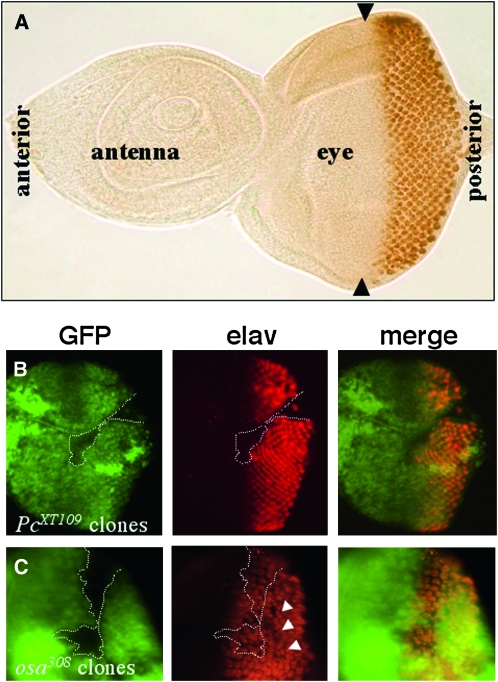
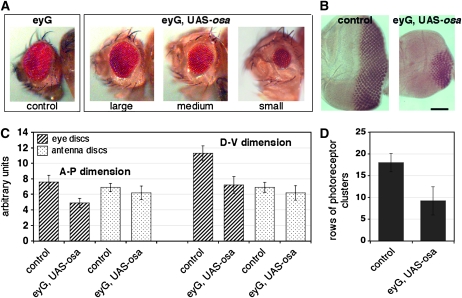
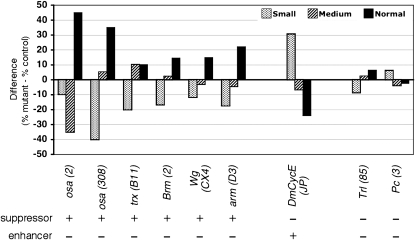
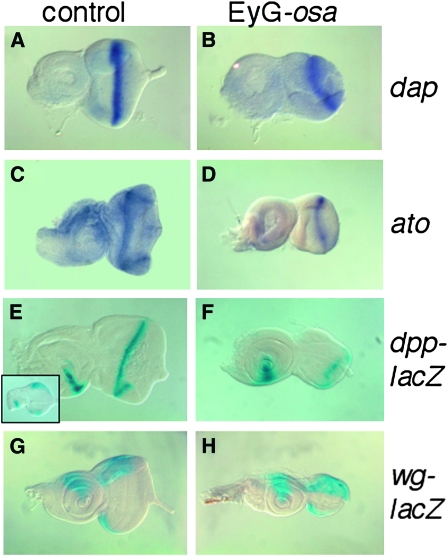
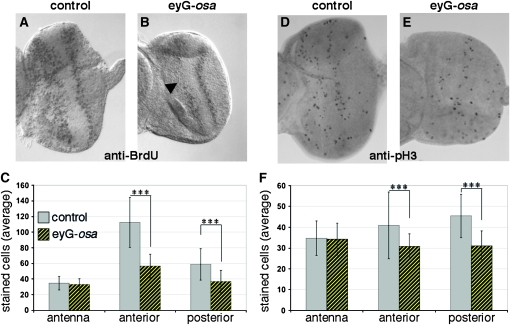
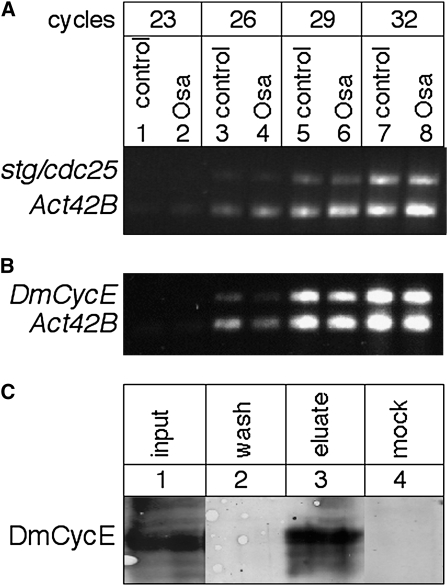
Coordinating cell proliferation and differentiation is essential during organogenesis. In Drosophila, the photoreceptor, pigment, and support cells of the eye are specified in an orchestrated wave as the morphogenetic furrow passes across the eye imaginal disc. Cells anterior of the furrow are not yet differentiated and remain mitotically active, while most cells in the furrow arrest at G(1) and adopt specific ommatidial fates. We used microarray expression analysis to monitor changes in transcription at the furrow and identified genes whose expression correlates with either proliferation or fate specification. Some of these are members of the Polycomb and Trithorax families that encode epigenetic regulators. Osa is one; it associates with components of the Drosophila SWI/SNF chromatin-remodeling complex. Our studies of this Trithorax factor in eye development implicate Osa as a regulator of the cell cycle: Osa overexpression caused a small-eye phenotype, a reduced number of M- and S-phase cells in eye imaginal discs, and a delay in morphogenetic furrow progression. In addition, we present evidence that Osa interacts genetically and biochemically with CyclinE. Our results suggest a dual mechanism of Osa function in transcriptional regulation and cell cycle control.


Figures

F<sc>igure</sc> 1.—
Figure 1.—
Microarray identification of transcripts enriched in the anterior or posterior region of the eye imaginal discs. (A) Cluster analysis of four replica experiments comparing microdissected posterior eye imaginal disc fragments to a common reference sample made from intact eye-antennal discs (columns). The two subclusters represent 431 transcripts (rows) with a predominant anterior (blue) and 435 transcripts with a posterior (yellow) expression that passed the significance of microarray analysis (SAM). The complete list of the 866 differentially expressed genes is available as Table S1. The legend provides the color-coded expression ratios. (B) Genes that are annotated to function in eye development and neuronal development are more abundant in the posterior group (hatched yellow; 18% posterior vs. 10% anterior), whereas genes that play a role in cellular growth and proliferation are overrepresented in the anterior group (blue; 13% anterior vs. 4% posterior). Genes were grouped on the basis of gene ontology terms (http://www.flybase.org, annotation release 5.16). A list is available as Table S2.
F<sc>igure</sc> 2.—
Figure 2.—
Comparison of transcript levels in mutant eye imaginal discs. (A) Schematic of the different experimental conditions that were compared to w1118 eye-antennal imaginal discs (reference sample, center). Mutants that produce an increased (extra R8 mutants, right) or decreased number of photoreceptor cells (stop furrow mutants, left) were analyzed. The numbers in parentheses refer to the different genotypes listed in Table S3 and in this legend. (B) Transcripts that were up- or downregulated in posterior fragments were compared to different mutant conditions using cluster analysis. Four subclusters (I–IV) were identified: Subcluster I showed predominant anterior and subcluster II posterior enrichment. Transcripts of subclusters III and IV showed a mixed behavior with anterior enrichment in the mutant discs and posterior enrichment in the w1118 eye-disc fragments (III) or the opposite (IV) (Table S4). The columns correspond to the 24 array hybridizations of three categories: stop furrow mutants (1–5), extra photoreceptor cell mutants (6 and 7), and posterior fragments (8). The numbers indicate the different genotypes of the replicate experiments: 1, roughDominant (roDom); 2, heterozygous roughDominant (roDom); 3, Enhancer(roDom)2033 [E(roDom)2033]; 4, atonal1 (ato1); 5, hedgehog1 (hh1); 6, roughX63 (roX63); 7, Su(roDom)519 (Dokucu et al. 1996; Chanut et al. 2000; all are homozygous except no. 2), and 8, microdissected posterior fragments (P) of w1118 eye imaginal discs; Table S3). The shades of blue and yellow color-code the expression ratios. (C) Expression profiles of selected genes from the four subclusters. The twin of eyeless (toy) gene shows enrichment in anterior cells (subcluster I) as it has been described (Czerny et al. 1999). sevenless (sev) and hedgehog (hh) are expressed in differentiating photoreceptor cells in the posterior part (subcluster II). The ribosomal protein L13 (Rpl13) is a representative of subcluster III with functions in cell proliferation, translation, and mitotic spindle assembly (Goshima et al. 2007). In the comparisons of the posterior fragments, eyeless (ey) shows expression in anterior cells as it has been reported previously (Parks et al. 1995). The chromatin regulators [Asx, Scm, Su(z)2, osa; compare text] that segregate to subcluster IV show the same expression properties as ey, i.e., up in the posterior cell in all mutant discs (nos. 1–7) and down in the posterior fragments (no. 8).
F<sc>igure</sc> 3.—
Figure 3.—
Loss of Polycomb and osa function disrupt eye development. (A) Wild-type eye-antennal imaginal disc labeled with anti-Elav. Differentiating photoreceptor cells (brown) are confined to the posterior half of the eye disc, behind the morphogenetic furrow (indicated by arrowheads). (B and C) Eye imaginal discs with mutant osa308 and PcXT109 cell clones were stained with anti-GFP to identify the position of the clones (absence of green GFP signal indicated by dotted lines) and anti-Elav (red) to mark differentiating photoreceptor cells. (B) No photoreceptor cells are specified within a large Pc clone. (C) A large osa clone disrupts the regular spacing of the photoreceptor clusters even outside the clone (arrowheads), indicating a cell-nonautonomous function.
F<sc>igure</sc> 4.—
Figure 4.—
Osa overexpression causes a small-eye phenotype. (A) Adult eyes of the parental eyeless-GAL4 line (control) and three different examples of Osa-overexpressing flies. Mutant eyes were grouped into three categories: large (close to normal), medium, and small. (B) Anti-Elav labeling of control eye discs and Osa-overexpressing discs shows a reduced number of photoreceptor cells in the mutant. The spacing and size of the clusters is only slightly disordered. Anterior is to the left. The bar corresponds to 100 μm in both images. (C) Quantification of the anterior-posterior (A-P) and dorso-ventral (D-V) dimensions of control and Osa-overexpressing antennal (hatched bars) and eye imaginal discs (dotted bars) of 40 animals in arbitrary units (materials and methods). The ey-GAL4 driver recapitulates expression in the eye field. The antennal part of the joint eye-antennal disc is not affected (Halder et al. 1998; Niimi et al. 2002). (D) The gray columns indicate counts of dorso-ventral rows of photoreceptor clusters that were labeled with anti-Elav in the same 40 eye discs. Standard deviations are indicated (Table S8).
F<sc>igure</sc> 5.—
Figure 5.—
Suppressors and enhancers of the Osa overexpression small-eye phenotype. Differences in the proportions of flies with small, medium, and close-to-normal-size eyes are indicated by bars of different shadings. Each experiment compares the eyes from Osa-overexpressing flies that are heterozygous for the indicated mutant allele to eyes of their siblings (control) that carry a balancer or marked chromosome (%mutant-%control). Alleles are indicated in parentheses. The two osa mutations and mutant alleles of trx, brm, wg, and arm act as suppressors, and DmCycEJP enhances the mutant phenotype. Mutations in Trl and Pc show only weak effects. Note that the DmCycEJP mutant caused a rough-eye phenotype when homozygous, while heterozygotes had normal eyes (Secombe et al. 1998). More than 500 flies were scored for each experiment (Table S10).
F<sc>igure</sc> 6.—
Figure 6.—
Eye discs remain small after Osa overexpression and morphogenetic furrow progression is retarded. (A, C, E, and G) Control eye-antennal imaginal discs. (B, D, F, and H) Osa-overexpressing discs. (A and B) Expression of dacapo or (C and D) atonal was detected by in situ hybridization. Following overexpression, the eye part remains smaller than in control discs, and the MF is positioned farther posteriorly and shows a characteristic half-moon shape. (E and F) X-gal reactions vizualized dpp-lacZ. The inset in E shows dpp-lacZ expression in a young third instar control disc. (F) The dpp-lacZ pattern along the MF is partially disrupted. (G and H) The wg-lacZ expression domain is comparable to the control. Pairwise comparisons of control and mutant discs are to scale. Anterior is to the left; dorsal is up.
F<sc>igure</sc> 7.—
Figure 7.—
The proportion of cycling cells in S phase and M phase is reduced after Osa overexpression. (A and D) Control. (B and E) Osa-overexpressing discs. (A and B) BrdU incorporation marks cells in S phase. Osa-overexpressing eye discs reveal a reduced signal intensity in the mutant eye discs (arrowhead in B), while the number of S-phase nuclei in the antennal part was comparable because ey-GAL4 does not drive expression in the antenna (Halder et al. 1998; Niimi et al. 2002). Two representative discs are shown. (C) Quantification of 15 control (gray bars) and 12 Osa-overexpressing discs (hatched yellow). The proportion of BrdU-positive cells in the antennal part is unaffected while fewer cells are labeled in the eye field anterior or posterior to the MF. (D and E) Immunolabeling with anti-phospho histone H3 antibody marks cells in G2 and M phase. Fewer cells were stained in the eye part of Osa-overexpressing discs. (F) Quantification of the reduced number of pH 3-positive cells. In the antennal parts, an average of 34 and 35 cells were in G2/M phase in 20 control discs (gray) and in 20 Osa-overexpressing discs (hatched yellow). In contrast, a reduction in the number of cycling cells occurred anterior as well as posterior to the MF. A Student's t-test revealed a confidence level of >99% (asterisks, Table S9).
F<sc>igure</sc> 8.—
Figure 8.—
Osa is physically associated with CycE and does not regulate string/cdc25 or CycE trancript levels. (A) Semiquantitative duplex RT–PCR on RNA from control and Osa-overexpressing eye discs with primer pairs that recognize the stg/cdc25 and Actin 42B (Act42B, standard) transcripts. Aliquots were removed from the PCR reaction after 23, 26, 29, and 32 cycles and analyzed on an agarose gel. stg/cdc25 levels are not different between the two genotypes relative to the Act42B levels. (B) Semiquantitative duplex RT–PCR for CyclinE (DmCycE) and Actin 42B. No obvious difference of CycE transcript levels could be detected between control and Osa-overexpressing discs. The slightly fainter signal in the Osa discs that also occurs in the Actin 42B reaction (compare lanes 3 and 4) might be due to reduced RNA levels of the mutant sample due to the smaller size of these discs. (C) Co-immunoprecipitation with anti-Osa (lanes 1–3) and anti-Engrailed (mock control) antibodies from embryonic nuclear extract. A prominent CycE band that migrates at ∼80 kDa as expected is detected in the lysate (lane 1, input). The wash solution contains no detectable CycE (lane 2). CycE protein is detected in the anti-Osa (lane 3, eluate) but not the anti-Engrailed (lane 4, mock) precipitate, indicating that the coprecipitation is specific to the Osa–CycE interaction. The photographs from lanes 1–3 originate from the same Western blot; empty lanes and additional wash steps were removed (the original image and additional Western blots are available as Figure S2).

Similar articles

Cited by

References

    1. Alvarez-Venegas, R., and Z. Avramova, 2002. SET-domain proteins of the Su(var)3–9, E(z) and trithorax families. Gene 285 25–37. - PubMed
    1. Baker, N. E., 2001. Cell proliferation, survival, and death in the Drosophila eye. Semin. Cell Dev. Biol. 12 499–507. - PubMed
    1. Baker, N. E., 2007. Patterning signals and proliferation in Drosophila imaginal discs. Curr. Opin. Genet. Dev. 17 287–293. - PubMed
    1. Baker, N. E., and S. Y. Yu, 1997. Proneural function of neurogenic genes in the developing Drosophila eye. Curr. Biol. 7 122–132. - PubMed
    1. Baonza, A., and M. Freeman, 2002. Control of Drosophila eye specification by Wingless signalling. Development 129 5313–5322. - PubMed

Publication types

MeSH terms