. 2010 Mar;9(3):523-37.
doi: 10.1074/mcp.M900559-MCP200. Epub 2009 Dec 14.

Threshold in stage-specific embryonic glycotypes uncovered by a full portrait of dynamic N-glycan expression during cell differentiation

Affiliations

Threshold in stage-specific embryonic glycotypes uncovered by a full portrait of dynamic N-glycan expression during cell differentiation

Maho Amano et al. Mol Cell Proteomics. 2010 Mar.

Abstract

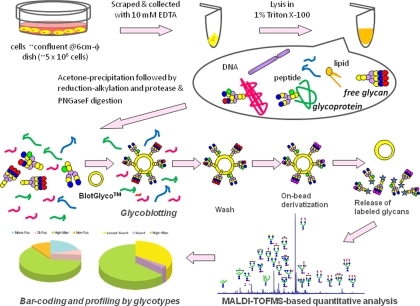
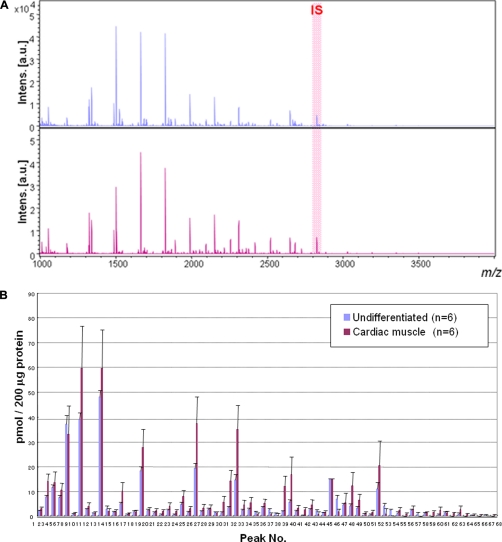
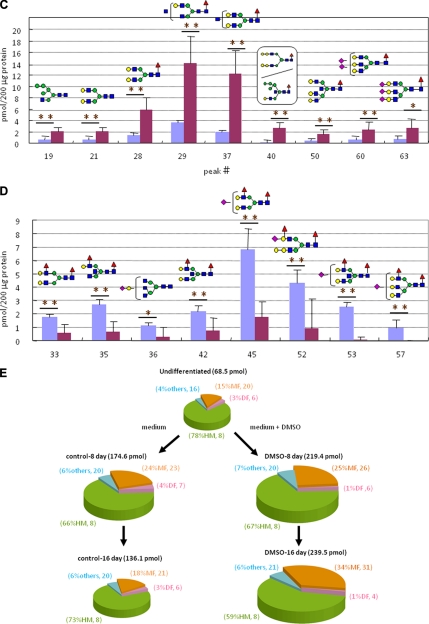
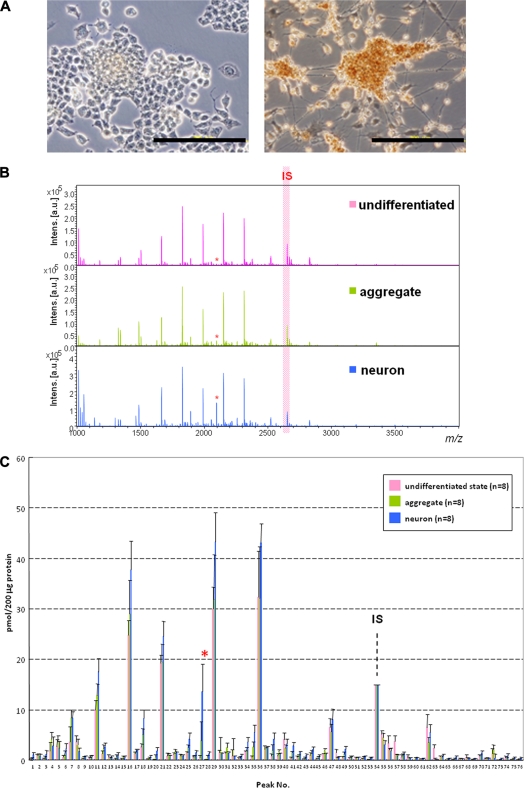
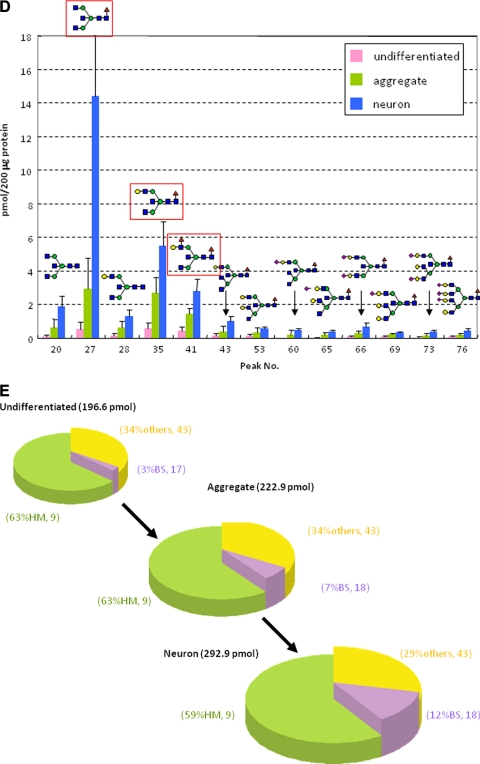
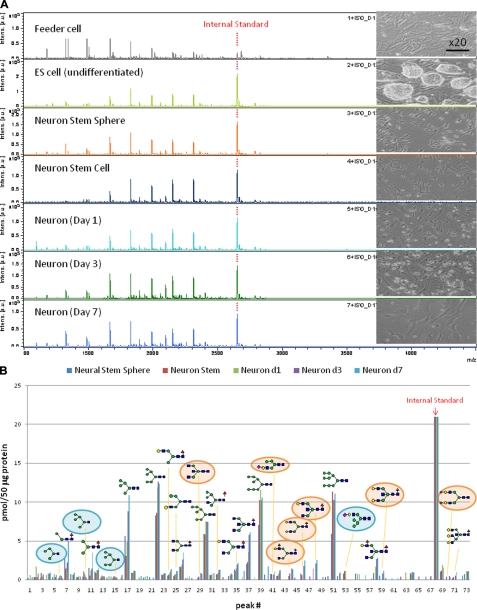
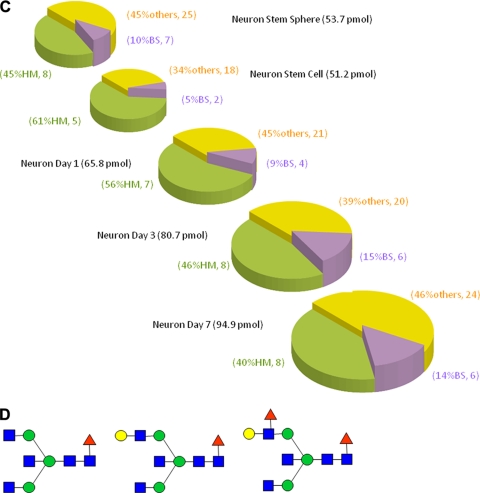
Although various glycoforms appear to participate independently in multiple molecular interactions in cellular adhesion that contribute to embryogenesis and organogenesis, a full portrait of the glycome diversity and the effect of the structural variations of cellular glycoforms on individual cell stages in proliferation and differentiation remain unclear. Here we describe a novel concept for the characterization of dynamic glycoform alteration during cell differentiation by means of "glycoblotting-based cellular glycomics," the only method allowing for rapid and quantitative glycan analysis. We demonstrated that processes of dynamic cellular differentiation of mouse embryonic carcinoma cells, P19CL6 and P19C6, and mouse embryonic stem cells into cardiomyocytes or neural cells can be monitored and characterized quantitatively by profiling entire N-glycan structures of total cell glycoproteins. Whole N-glycans enriched and identified by the glycoblotting method (67 glycans for P19CL6, 75 glycans for P19C6, and 72 glycans for embryonic stem cells) were profiled and bar-coded quantitatively with respect to the ratio of subgroups composed of characteristic glycoforms, namely glycotypes.


Figures

Fig. 1.
Fig. 1.
Basic protocol of high throughput and quantitative cellular glycomics based on glycoblotting method using BlotGlyco H bead. φ, inner diameter; PNGaseF, peptide-N-glycosidase F.
Fig. 2.
Fig. 2.
Differentiation of P19CL6 cells to cardiomyocytes in presence of DMSO. A, RT-PCR analysis for the confirmation of cellular differentiation to cardiac muscle. M, DNA size marker (bp); lanes 1, 5, and 9, β-actin (503 bp), lanes 2, 6, and 10, α-cardiac myosin heavy chain (302 bp); lanes 3, 7, and 11, β-cardiac myosin heavy chain (205 bp); lanes 4, 8, and 12, embryonic skeletal muscle (151 bp). B, immunocytochemistry for the confirmation of P19CL6 cell differentiation to cardiac muscle. Primary antibody, MF20 (mouse monoclonal anti-sarcomere myosin); secondary antibody, HRP polymer-conjugated IgG; chromogenic substrate, diaminobenzidine. The bar represents 1.0 cm.
Fig. 3.
Fig. 3.
Large scale N-glycan analysis during P19CL6 cell differentiation. A, MALDI-TOF-MS of whole N-glycans of undifferentiated and differentiated cells. IS, internal standard. B, quantitative and total glycomics of undifferentiated and differentiated cells. C, magnification to visualize increased glycans (*, p < 0.01; **, p < 0.05). D, magnification to visualize decreased glycans (*, p < 0.01; **, p < 0.05). Error bars mean standard deviations. E, bar coding analysis. Intens., intensity; a.u., arbitrary units.
Fig. 3.
Fig. 3.
Large scale N-glycan analysis during P19CL6 cell differentiation. A, MALDI-TOF-MS of whole N-glycans of undifferentiated and differentiated cells. IS, internal standard. B, quantitative and total glycomics of undifferentiated and differentiated cells. C, magnification to visualize increased glycans (*, p < 0.01; **, p < 0.05). D, magnification to visualize decreased glycans (*, p < 0.01; **, p < 0.05). Error bars mean standard deviations. E, bar coding analysis. Intens., intensity; a.u., arbitrary units.
Fig. 4.
Fig. 4.
Differentiation of P19C6 cells to neural cells. A, immunocytochemistry for the confirmation of neural differentiation. Primary antibody, mouse monoclonal anti-neurofilament 160; secondary antibody, HRP polymer-conjugated IgG; chromogenic substrate, diaminobenzidine. The bar represents 200 μm. B, MALDI-TOF-MS of whole N-glycans of undifferentiated and differentiated cells. IS, internal standard. * represents peak number 27. C, quantitative and total glycomics of undifferentiated and differentiated cells. IS, internal standard. * represents peak number 27. D, magnification to visualize increased glycans. E, bar coding analysis.
Fig. 4.
Fig. 4.
Differentiation of P19C6 cells to neural cells. A, immunocytochemistry for the confirmation of neural differentiation. Primary antibody, mouse monoclonal anti-neurofilament 160; secondary antibody, HRP polymer-conjugated IgG; chromogenic substrate, diaminobenzidine. The bar represents 200 μm. B, MALDI-TOF-MS of whole N-glycans of undifferentiated and differentiated cells. IS, internal standard. * represents peak number 27. C, quantitative and total glycomics of undifferentiated and differentiated cells. IS, internal standard. * represents peak number 27. D, magnification to visualize increased glycans. E, bar coding analysis.
Fig. 5.
Fig. 5.
Differentiation of mouse ESCs to neural cells. A, MALDI-TOF-MS spectra during cell differentiation. B, quantitative glycan profiling during ESC differentiation. C, bar coding analysis. D, novel glycan biomarkers for identifying and monitoring the processes of mouse neural cell differentiation. Intens., intensity; a.u., arbitrary units; d, day.
Fig. 5.
Fig. 5.
Differentiation of mouse ESCs to neural cells. A, MALDI-TOF-MS spectra during cell differentiation. B, quantitative glycan profiling during ESC differentiation. C, bar coding analysis. D, novel glycan biomarkers for identifying and monitoring the processes of mouse neural cell differentiation. Intens., intensity; a.u., arbitrary units; d, day.

Similar articles

Cited by

References

    1. Stanton L. W., Bakre M. M. (2007) Genomic and proteomic characterization of embryonic stem cells. Curr. Opin. Chem. Biol 11, 399–404 - PubMed
    1. Kuramitsu Y., Nakamura K. (2006) Proteomic analysis of cancer tissues: shedding light on carcinogenesis and possible biomarkers. Proteomics 6, 5650–5661 - PubMed
    1. Gonnet F., Bouazza B., Millot G. A., Ziaei S., Garcia L., Butler-Browne G. S., Mouly V., Tortajada J., Danos O., Svinartchouk F. (2008) Proteome analysis of differentiating human myoblasts by dialysis-assisted two-dimensional gel electrophoresis (DAGE). Proteomics 8, 264–278 - PubMed
    1. Watkins J., Basu S., Bogenhagen D. F. (2008) A quantitative proteomic analysis of mitochondrial participation in p19 cell neuronal differentiation. J. Proteome Res 7, 328–338 - PMC - PubMed
    1. Loring J. F., Rao M. S. (2006) Establishing standards for the characterization of human embryonic stem cell lines. Stem Cells 24, 145–150 - PubMed

Publication types

MeSH terms

LinkOut - more resources