

The nutrigenetics of hyperhomocysteinemia: quantitative proteomics reveals differences in the methionine cycle enzymes of gene-induced versus diet-induced hyperhomocysteinemia
- PMID: 20008833
- PMCID: PMC2849704
- DOI: 10.1074/mcp.M900406-MCP200
The nutrigenetics of hyperhomocysteinemia: quantitative proteomics reveals differences in the methionine cycle enzymes of gene-induced versus diet-induced hyperhomocysteinemia
Abstract
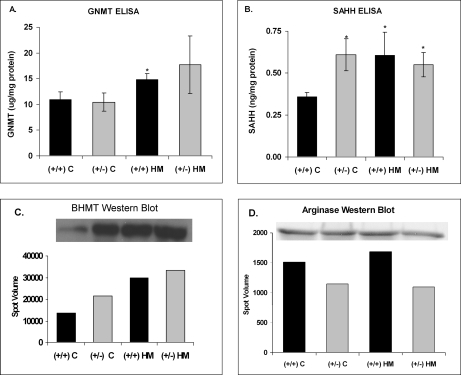
Hyperhomocysteinemia has long been associated with atherosclerosis and thrombosis and is an independent risk factor for cardiovascular disease. Its causes include both genetic and environmental factors. Although homocysteine is produced in every cell as an intermediate of the methionine cycle, the liver contributes the major portion found in circulation, and fatty liver is a common finding in homocystinuric patients. To understand the spectrum of proteins and associated pathways affected by hyperhomocysteinemia, we analyzed the mouse liver proteome of gene-induced (cystathionine beta-synthase (CBS)) and diet-induced (high methionine) hyperhomocysteinemic mice using two-dimensional difference gel electrophoresis and Ingenuity Pathway Analysis. Nine proteins were identified whose expression was significantly changed by 2-fold (p < or = 0.05) as a result of genotype, 27 proteins were changed as a result of diet, and 14 proteins were changed in response to genotype and diet. Importantly, three enzymes of the methionine cycle were up-regulated. S-Adenosylhomocysteine hydrolase increased in response to genotype and/or diet, whereas glycine N-methyltransferase and betaine-homocysteine methyltransferase only increased in response to diet. The antioxidant proteins peroxiredoxins 1 and 2 increased in wild-type mice fed the high methionine diet but not in the CBS mutants, suggesting a dysregulation in the antioxidant capacity of those animals. Furthermore, thioredoxin 1 decreased in both wild-type and CBS mutants on the diet but not in the mutants fed a control diet. Several urea cycle proteins increased in both diet groups; however, arginase 1 decreased in the CBS(+/-) mice fed the control diet. Pathway analysis identified the retinoid X receptor signaling pathway as the top ranked network associated with the CBS(+/-) genotype, whereas xenobiotic metabolism and the NRF2-mediated oxidative stress response were associated with the high methionine diet. Our results show that hyperhomocysteinemia, whether caused by a genetic mutation or diet, alters the abundance of several liver proteins involved in homocysteine/methionine metabolism, the urea cycle, and antioxidant defense.
Figures


Similar articles
-
Dysregulated Hepatic Methionine Metabolism Drives Homocysteine Elevation in Diet-Induced Nonalcoholic Fatty Liver Disease.PLoS One. 2015 Aug 31;10(8):e0136822. doi: 10.1371/journal.pone.0136822. eCollection 2015. PLoS One. 2015. PMID: 26322888 Free PMC article.
-
Dietary intake of S-(alpha-carboxybutyl)-DL-homocysteine induces hyperhomocysteinemia in rats.Nutr Res. 2010 Jul;30(7):492-500. doi: 10.1016/j.nutres.2010.06.017. Nutr Res. 2010. PMID: 20797482 Free PMC article.
-
Tissue-specific downregulation of dimethylarginine dimethylaminohydrolase in hyperhomocysteinemia.Am J Physiol Heart Circ Physiol. 2008 Aug;295(2):H816-25. doi: 10.1152/ajpheart.01348.2007. Epub 2008 Jun 20. Am J Physiol Heart Circ Physiol. 2008. PMID: 18567702 Free PMC article.
-
[Hyperhomocysteinemia: an independent risk factor or a simple marker of vascular disease?. 1. Basic data].Pathol Biol (Paris). 2003 Mar;51(2):101-10. doi: 10.1016/s0369-8114(03)00104-4. Pathol Biol (Paris). 2003. PMID: 12801808 Review. French.
-
The pathophysiological hypothesis of homocysteine thiolactone-mediated vascular disease.J Physiol Pharmacol. 2008 Dec;59 Suppl 9:155-67. J Physiol Pharmacol. 2008. PMID: 19261978 Review.
Cited by
-
A(a)LS: Ammonia-induced amyotrophic lateral sclerosis.F1000Res. 2015 May 14;4:119. doi: 10.12688/f1000research.6364.1. eCollection 2015. F1000Res. 2015. PMID: 27785351 Free PMC article.
-
Dysregulation of Epigenetic Mechanisms of Gene Expression in the Pathologies of Hyperhomocysteinemia.Int J Mol Sci. 2019 Jun 27;20(13):3140. doi: 10.3390/ijms20133140. Int J Mol Sci. 2019. PMID: 31252610 Free PMC article. Review.
-
Hypermethylation: Causes and Consequences in Skeletal Muscle Myopathy.J Cell Biochem. 2017 Aug;118(8):2108-2117. doi: 10.1002/jcb.25841. Epub 2017 Apr 21. J Cell Biochem. 2017. PMID: 27982479 Free PMC article. Review.
-
Effects of dietary salt on gene and protein expression in brain tissue of a model of sporadic small vessel disease.Clin Sci (Lond). 2018 Jun 26;132(12):1315-1328. doi: 10.1042/CS20171572. Print 2018 Jun 29. Clin Sci (Lond). 2018. PMID: 29632138 Free PMC article.
-
Hyperhomocysteinemia during aortic aneurysm, a plausible role of epigenetics.Int J Physiol Pathophysiol Pharmacol. 2013;5(1):32-42. Epub 2013 Mar 8. Int J Physiol Pathophysiol Pharmacol. 2013. PMID: 23525608 Free PMC article.
References
-
- Finkelstein J. D., Martin J. J. (1984) Methionine metabolism in mammals. Distribution of homocysteine between competing pathways. J. Biol. Chem 259, 9508–9513 - PubMed
-
- Reed M. C., Nijhout H. F., Sparks R., Ulrich C. M. (2004) A mathematical model of the methionine cycle. J. Theor. Biol 226, 33–43 - PubMed
-
- Storch K. J., Wagner D. A., Burke J. F., Young V. R. (1988) Quantitative study in vivo of methionine cycle in humans using [methyl-2H3]- and [1–13C]methionine. Am. J. Physiol. Endocrinol. Metab 255, E322–E331 - PubMed
-
- Christensen B., Refsum H., Vintermyr O., Ueland P. M. (1991) Homocysteine export from cells cultured in the presence of physiological or superfluous levels of methionine: methionine loading of non-transformed, transformed, proliferating, and quiescent cells in culture. J. Cell. Physiol 146, 52–62 - PubMed
Publication types
MeSH terms
Substances
Grants and funding
LinkOut - more resources
Full Text Sources
Medical
Research Materials
