

Overexpression of phospho-eIF4E is associated with survival through AKT pathway in non-small cell lung cancer
- PMID: 20008839
- PMCID: PMC7581274
- DOI: 10.1158/1078-0432.CCR-09-0986
Overexpression of phospho-eIF4E is associated with survival through AKT pathway in non-small cell lung cancer
Abstract
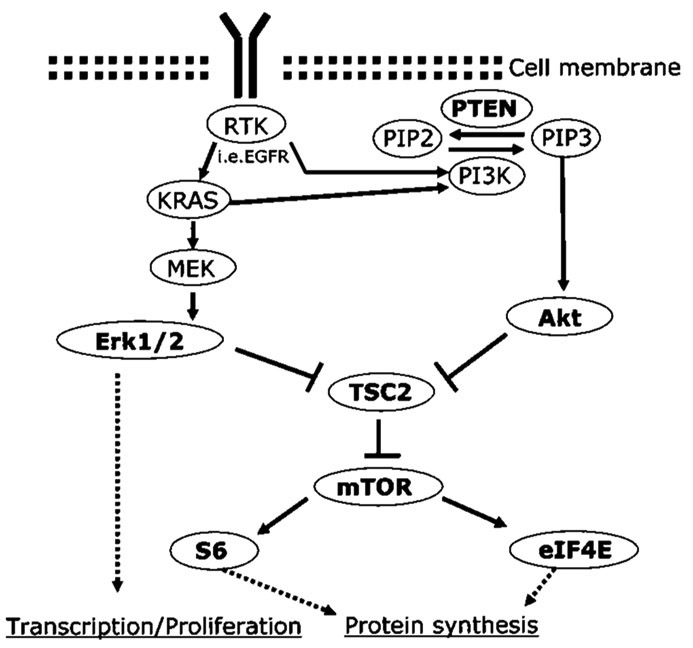
Purpose: The eukaryotic translation initiation factor complex 4E (eIF4E) is downstream in the mammalian target of rapamycin (mTOR) pathway. This study explored expression of eIF4E and its relationship with the PTEN/AKT and RAS/MEK/ERK pathways in non-small cell lung carcinoma (NSCLC).
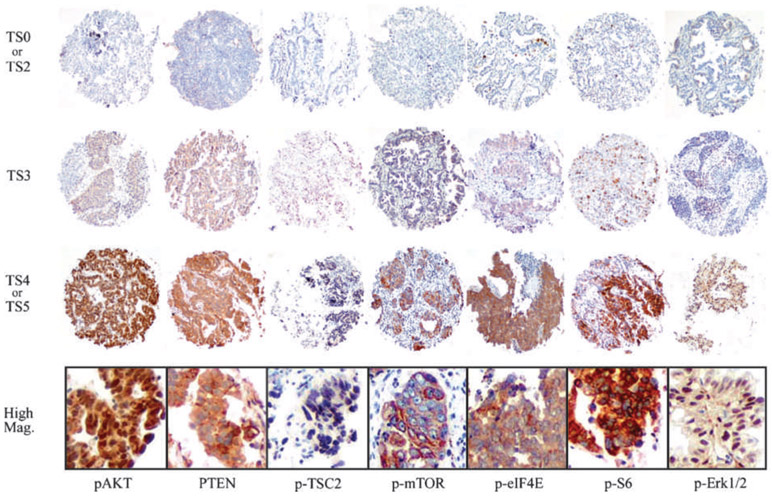
Experimental design: The status of phosphorylated eIF4E (p-eIF4E), phosphorylated AKT (p-AKT), PTEN, phosphorylated tuberin (p-TSC2), phosphorylated mTOR (p-mTOR), phosphorylated S6 (p-S6), and phosphorylated Erk1/2 (p-Erk1/2) was studied using immunohistochemical analysis applied to a tissue microarray containing 300 NSCLCs. Staining results for each antibody were compared with clinical and pathologic features, and the relationship between staining results was explored.
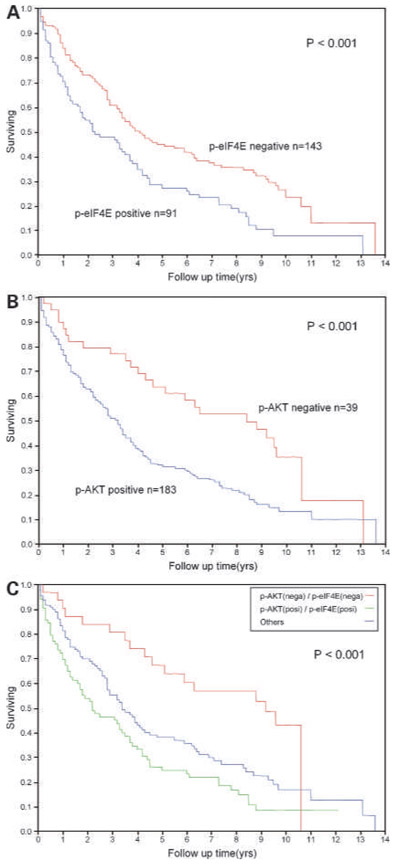
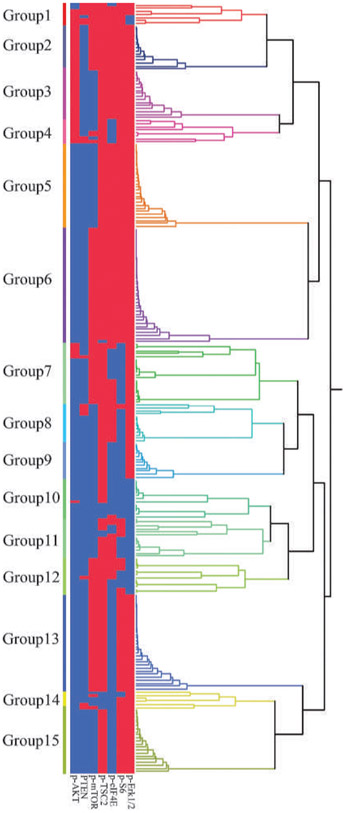
Results: Overexpression of p-eIF4E, p-AKT, p-TSC2, p-mTOR, p-S6, and p-Erk1/2 in NSCLC was found in 39.9%, 78.8%, 5.1%, 46.7%, 27.1%, and 16.6% of tumors, respectively. The phenotype of p-eIF4E correlated positively with that of p-AKT, p-TSC2, and p-S6 (P < 0.001). Overall survival in NSCLC patients was significantly shorter in cases with overexpression of p-eIF4E and p-AKT alone and in combination (log-rank P < 0.001, each). Cases with underexpression of PTEN were limited (6.4%), and this phenotype did not correlate with any clinical variable. In cluster analysis, the p-AKT/p-mTOR/p-eIF4E/p-S6-positive group had significantly shorter survival compared with the survival of all cases (P < 0.001). Multivariate analysis showed that p-eIF4E overexpression is an independent prognostic factor for NSCLC (P = 0.004).
Conclusions: This study shows that p-eIF4E expression in addition to p-AKT predicts poor prognosis in NSCLC. Moreover, the correlation between expression of p-eIF4E with p-AKT, as well as p-TSC2 and p-S6, indicates that eIF4E activation through the AKT pathway plays an important role in the progression of NSCLC.
Conflict of interest statement
Disclosure of Potential Conflicts of Interest
No potential conflicts of interest were disclosed.
Figures
References
-
- Jemal A, Siegel R, Ward E, Murray T, Xu J, Thun MJ. Cancer statistics, 2007. CA Cancer J Clin 2007;57:43–66. - PubMed
-
- Travis WD, Brambilla E, Muller-Hermelink HK, Harris CC. Pathology & genetics of tumours of the lung, thymus and heart. IARC/World Health Organization of Tumours; 2004.
-
- Thompson JE, Thompson CB. Putting the rap on Akt. J Clin Oncol 2004;22:4217–26. - PubMed
-
- Hennessy BT, Smith DL, Ram PT, Lu Y, Mills GB. Exploiting the PI3K/AKT pathway for cancer drug discovery. Nat Rev Drug Discov 2005;4:988–1004. - PubMed
-
- Altomare DA, Testa JR. Perturbations of the AKT signaling pathway in human cancer. Oncogene 2005;24:7455–64. - PubMed
MeSH terms
Substances
Grants and funding
LinkOut - more resources
Full Text Sources
Other Literature Sources
Medical
Molecular Biology Databases
Research Materials
Miscellaneous
