. 2010 Jan 1;24(1):21-32.
doi: 10.1101/gad.1876110. Epub 2009 Dec 15.

The histone variant macroH2A1 marks repressed autosomal chromatin, but protects a subset of its target genes from silencing

Affiliations

The histone variant macroH2A1 marks repressed autosomal chromatin, but protects a subset of its target genes from silencing

Matthew J Gamble et al. Genes Dev. .

Abstract

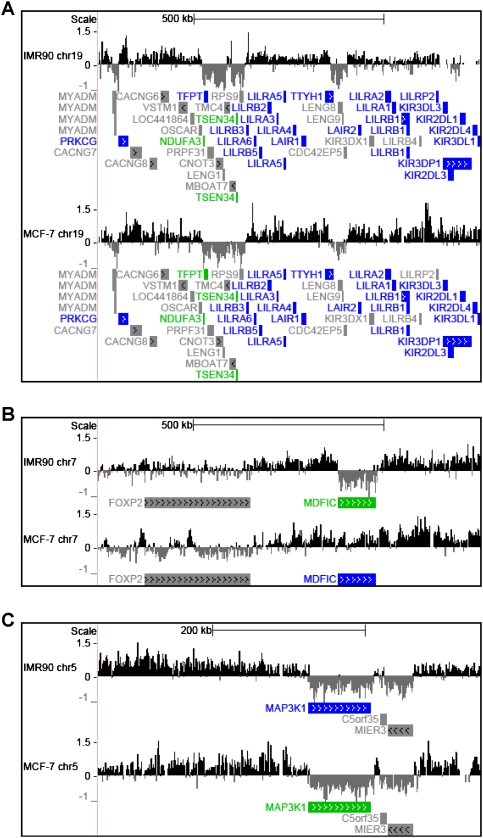
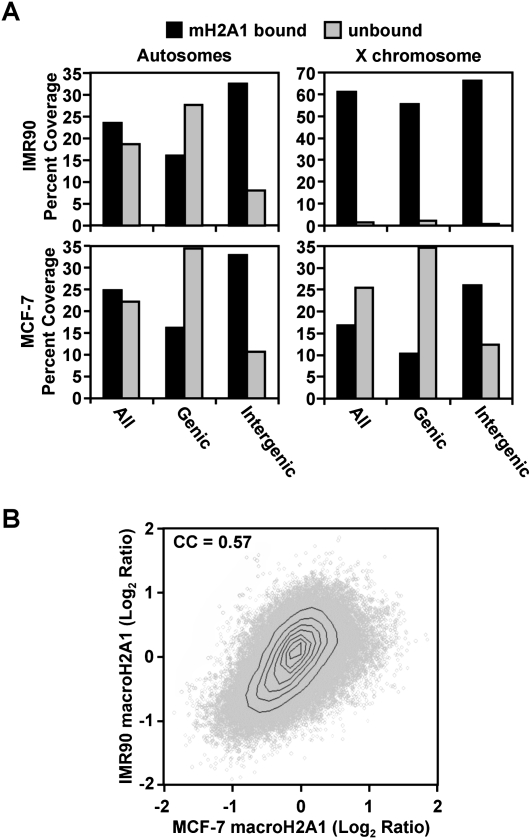
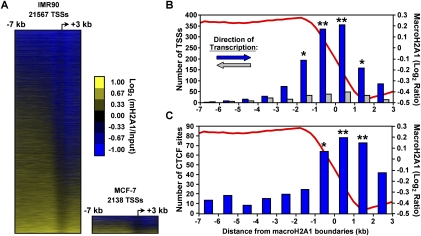
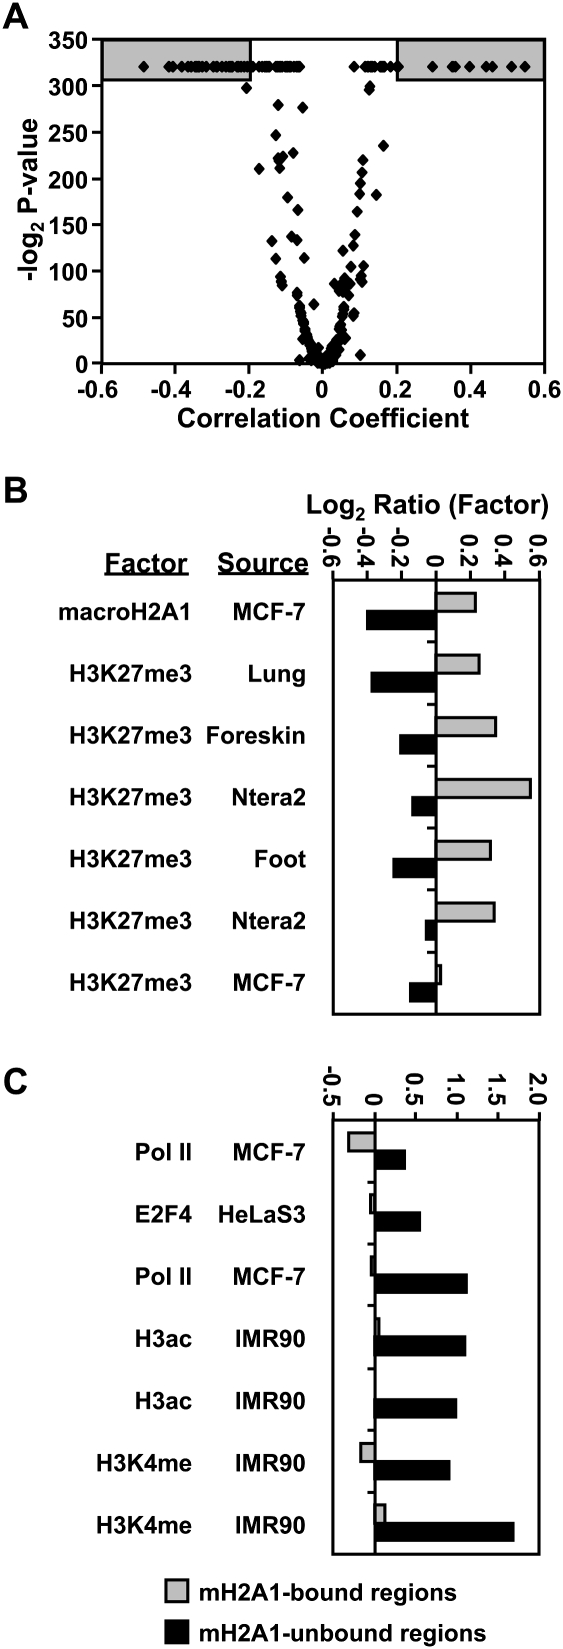
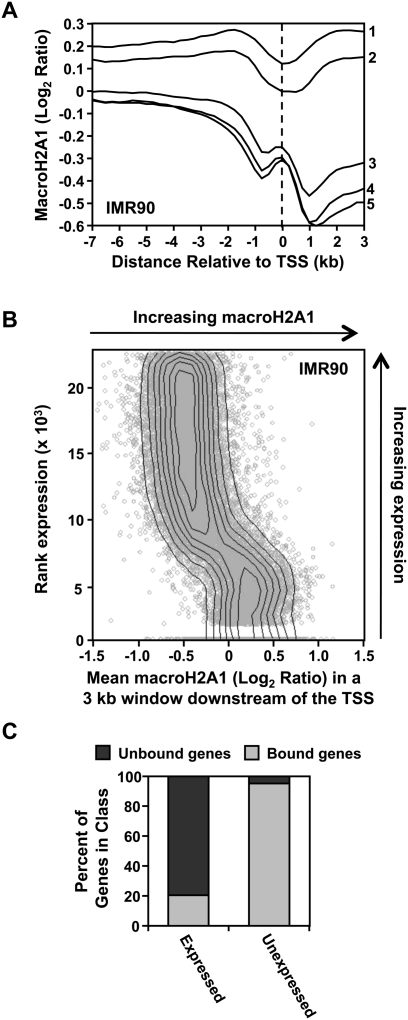
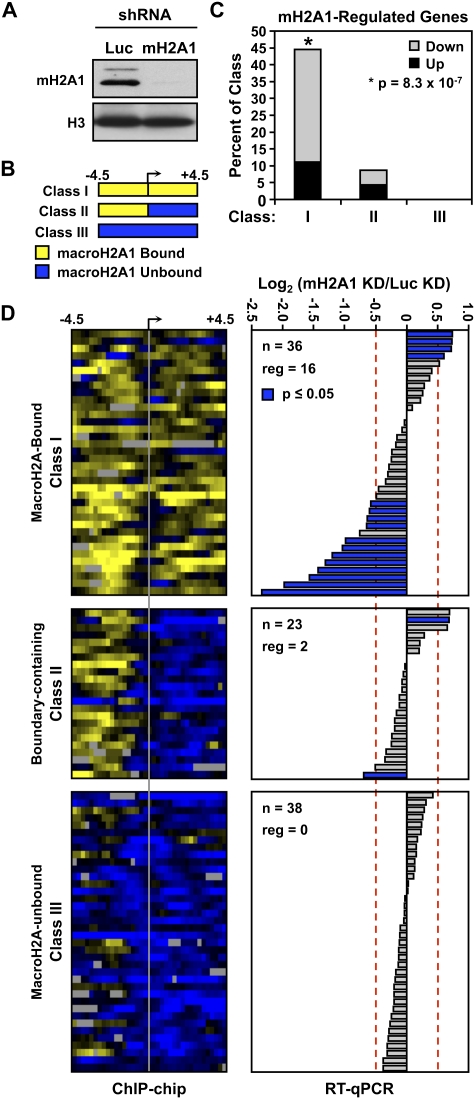
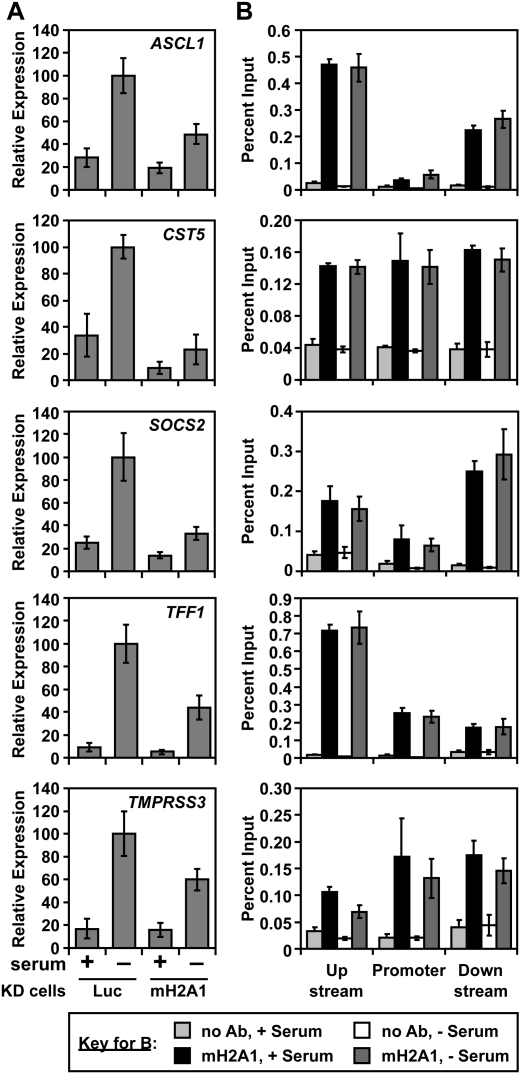
MacroH2A1 is a histone variant that is enriched on the inactive X chromosome (Xi) in mammals and is postulated to play an important, but unknown, role in the repression of gene expression. Here we show that, although macroH2A1 marks repressed autosomal chromatin, it positively regulates transcription when located in the transcribed regions of a subset of its target genes. We used chromatin immunoprecipitation (ChIP) coupled with tiling microarrays (ChIP-chip) to determine the genomic localization of macroH2A1 in IMR90 human primary lung fibroblasts and MCF-7 breast cancer cells. The patterns of macroH2A1 deposition are largely similar across the autosomes of both cell lines. Our studies revealed a genomic localization pattern unique among histone variants; namely, the occupation by macroH2A1 of large chromatin domains (>500 kb in some cases) that contain repressive chromatin marks (e.g., histone H3 Lys 27 trimethylation). The boundaries of macroH2A1-containing domains tend to occur in promoter-proximal regions. Not all promoters, however, serve as macroH2A1 boundaries; many macroH2A1-containing chromatin domains invade the transcribed regions of genes whose products play key roles in development and cell-cell signaling. Surprisingly, the expression of a subset of these genes is positively regulated by macroH2A1. MacroH2A1 also plays a role in augmenting signal-regulated transcription, specifically for genes responsive to serum starvation. Collectively, our results document an unexpected role for macroH2A1 in the escape from heterochromatin-associated silencing and the enhancement of autosomal gene transcription.


Figures

Figure 1.
Figure 1.
MacroH2A1 is incorporated into chromatin in large domains. University of California at Santa Cruz genome browser-generated (http://genome.ucsc.edu) histogram showing the log2 ratios of macroH2A1 ChIP over input for both IMR90 and MCF-7 cells. The location and orientation of RefSeq genes are depicted below each track. Gene expression in each cell line is color-coded. Expressed genes are colored green, unexpressed genes are colored blue, and genes with ambiguous expression are colored gray. (A) A 1-Mb span of chromosome 19 (ENCODE region ENm007). (B) A 1-Mb span of chromosome 7 (ENCODE region ENm012). (C) A 500-kb span of chromosome 5 (ENCODE region ENr221).
Figure 2.
Figure 2.
In addition to the inactive X chromosome, macroH2A1 occupies a large proportion of autosomal chromatin. (A) Histogram showing the percent base coverage of macroH2A1-bound and macroH2A1-unbound regions in either an IMR90 or MCF-7 cell subset for genic or intergenic regions on either autosomes or the X chromosome. (B) Scatter plot of the macroH2A1 ChIP–chip log2 ratios from MCF-7 cells versus IMR90 cells for the 94,966 windows occupied by at least six probes on both array platforms. (CC) Spearman correlation coefficient of the data presented in the scatter plot (P < 10−300).
Figure 3.
Figure 3.
TSSs and CTCF-binding sites are enriched near macroH2A1-containing domain boundaries. (A) Heat map showing macroH2A1 ChIP–chip data for all 21,567 or 2138 promoters from the IMR90 and MCF-7 data, respectively (from −7 kb to +3 kb relative to the TSS), ordered for average macroH2A1 intensity. (B) Histogram representing the locations of TSSs relative to macroH2A1 domain boundaries in IMR90 cells. The bars are color-coded to indicate the direction of gene transcription relative to the orientation of the macroH2A1 boundary. Asterisks denote significant bars with P-value < 10−8 (*) or P-value < 10−67 (**). (C) Histogram representing the locations of CTCF-binding sites relative to macroH2A1 domain boundaries in IMR90 cells. Asterisks denote significant bars with P-value = 10−7 (*) or P-value < 10−12 (**).
Figure 4.
Figure 4.
MacroH2A1 binding positively correlates with heterochromatic chromatin marks and negatively correlates with active chromatin marks. (A) Volcano plot of Spearman's correlation coefficient for the macroH2A1 ChIP–chip data from IMR90 cells with each of 367 ChIP–chip data sets versus the corresponding significance score (−log2 P-value). (B) Average log2 ratios in macroH2A1-bound and unbound regions for the seven most positive correlations. (C) Same as in B for the seven most negative correlations.
Figure 5.
Figure 5.
MacroH2A1 levels downstream from the TSS, while negatively correlated with expression, are not an absolute marker of silent genes. (A) Average macroH2A1 ChIP–chip profiles from IMR90 cells of genes in expression pentiles ranked from least to most expressed based on GRO-seq data. (B) Scatter plot of the average level of macroH2A1 found in the first 3 kb of a gene versus the rank level of gene expression based on GRO-seq data. (C) Histogram depicting the percent of expressed and unexpressed genes containing macroH2A1 downstream from the TSS.
Figure 6.
Figure 6.
Depletion of macroH2A1 reveals a positive role for macroH2A1 in the expression of class I genes. (A) Western blot for macroH2A1 in MCF-7 cells with stably integrated expression vectors for shRNAs targeting luciferase (Luc) or macroH2A1 (mH2A). (B) Schematic representation of the three observed macroH2A1-binding patterns relative to the TSSs. (C) Histogram depicting the percent of genes tested from each class that pass both the fold change (i.e., log2 0.5) and P-value (≤0.05) thresholds. The asterisk denotes significant enrichment of regulated genes in class I based on the P-value from a Fisher exact test (P = 8.3 × 10⁻⁷). The gray and black shading represents the proportions of genes that are down-regulated or up-regulated in the macroH2A1 knockdown cell line, respectively. (D, left) Heat map depicting the macroH2A1-binding patterns of all genes tested by RT-qPCR for regulation by macroH2A1 knockdown separated into the three macroH2A1-based gene classes. (Right) Log2 fold change in expression upon macroH2A1 knockdown (macroH2A1/Luc) for each of the genes shown in the heat map to the left. The dotted lines depict the log2 fold change threshold of 0.5. Blue bars indicate a P-value of 0.05 or less. (mH2A1) MacroH2A1; (KD) knockdown.
Figure 7.
Figure 7.
MacroH2A1 modulates signal-regulated transcriptional responses of macroH2A1-containing genes. (A) Relative expression of five macroH2A1-containing, serum starvation-activated genes in luciferase or macroH2A1 knockdown cells either in serum (+) or deprived of serum for 24 h (−). Experiments were scaled to yield a value of 100 for the Lucifierase knockdown serum-starved samples. All differences between serum-deprived Luciferase and macroH2A knockdown samples were significant (P < 0.02). (B) MacroH2A1 ChIP from MCF-7 cells with or without 24 h of serum starvation.

Similar articles

Cited by

References

    1. Abbott DW, Laszczak M, Lewis JD, Su H, Moore SC, Hills M, Dimitrov S, Ausio J. Structural characterization of macroH2A containing chromatin. Biochemistry. 2004;43:1352–1359. - PubMed
    1. Agelopoulos M, Thanos D. Epigenetic determination of a cell-specific gene expression program by ATF-2 and the histone variant macroH2A. EMBO J. 2006;25:4843–4853. - PMC - PubMed
    1. Ahel D, Horejsi Z, Wiechens N, Polo SE, Garcia-Wilson E, Ahel I, Flynn H, Skehel M, West SC, Jackson SP, et al. Poly(ADP-ribose)-dependent regulation of DNA repair by the chromatin remodeling enzyme ALC1. Science. 2009;325:1240–1243. - PMC - PubMed
    1. Angelov D, Molla A, Perche PY, Hans F, Cote J, Khochbin S, Bouvet P, Dimitrov S. The histone variant macroH2A interferes with transcription factor binding and SWI/SNF nucleosome remodeling. Mol Cell. 2003;11:1033–1041. - PubMed
    1. Angelov D, Bondarenko VA, Almagro S, Menoni H, Mongelard F, Hans F, Mietton F, Studitsky VM, Hamiche A, Dimitrov S, et al. Nucleolin is a histone chaperone with FACT-like activity and assists remodeling of nucleosomes. EMBO J. 2006;25:1669–1679. - PMC - PubMed

Publication types