. 2009 Dec 15;23(24):2824-38.
doi: 10.1101/gad.1861209.

Transcriptional competence and the active marking of tissue-specific enhancers by defined transcription factors in embryonic and induced pluripotent stem cells

Affiliations

Transcriptional competence and the active marking of tissue-specific enhancers by defined transcription factors in embryonic and induced pluripotent stem cells

Jian Xu et al. Genes Dev. .

Abstract

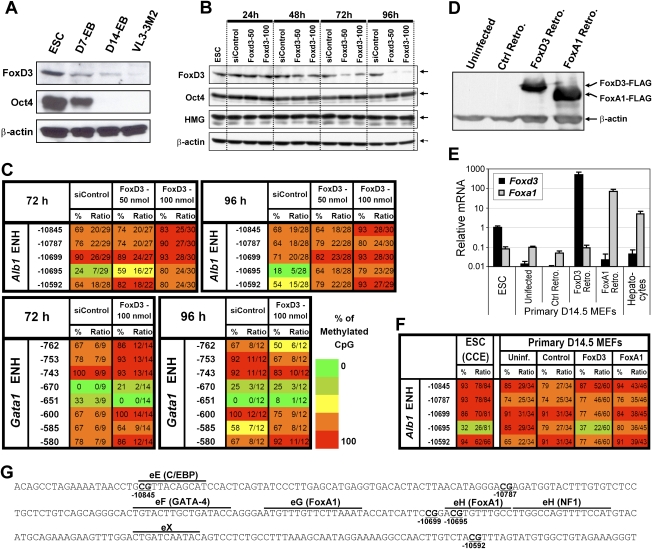
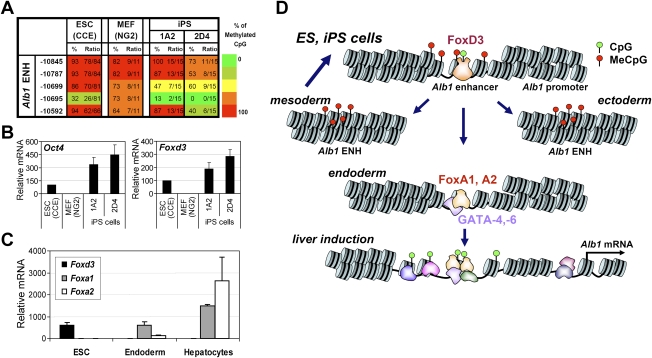
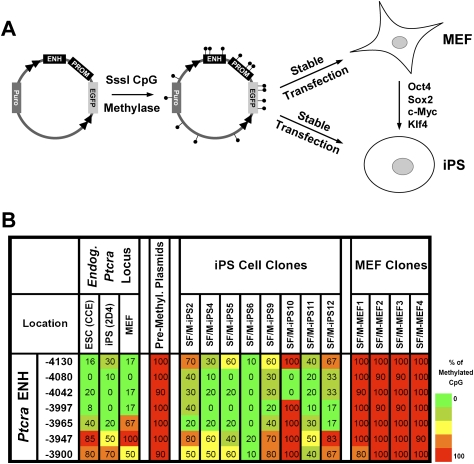
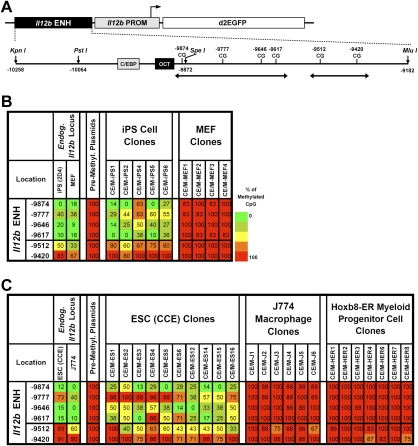
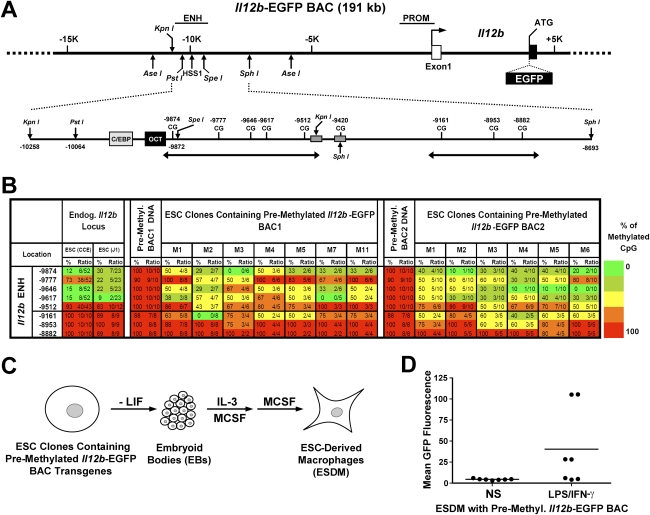
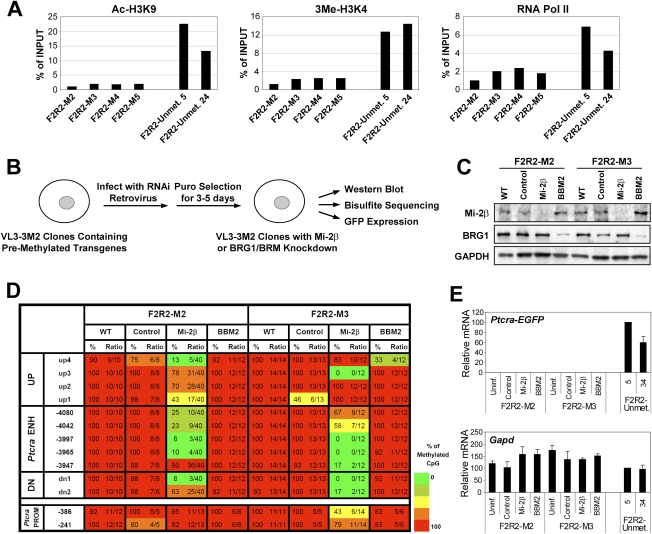
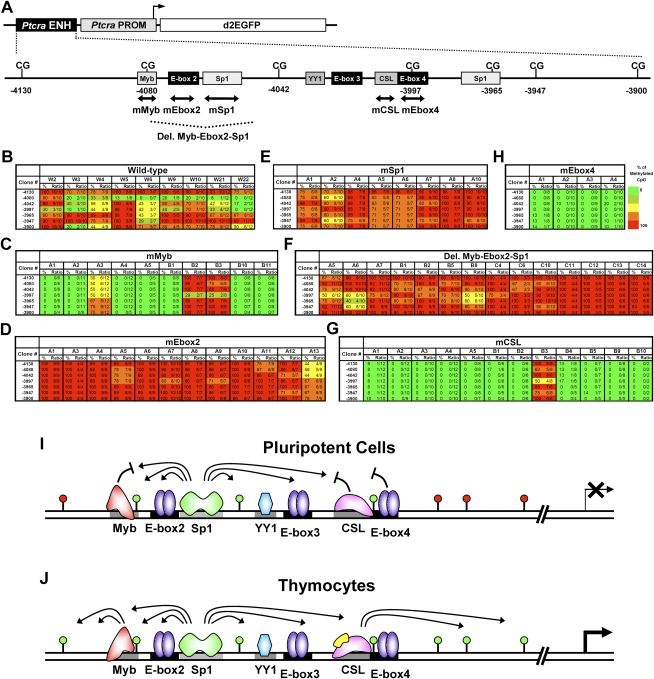
We reported previously that well-characterized enhancers but not promoters for typical tissue-specific genes, including the classic Alb1 gene, contain unmethylated CpG dinucleotides and evidence of pioneer factor interactions in embryonic stem (ES) cells. These properties, which are distinct from the bivalent histone modification domains that characterize the promoters of genes involved in developmental decisions, raise the possibility that genes expressed only in differentiated cells may need to be marked at the pluripotent stage. Here, we demonstrate that the forkhead family member FoxD3 is essential for the unmethylated mark observed at the Alb1 enhancer in ES cells, with FoxA1 replacing FoxD3 following differentiation into endoderm. Up-regulation of FoxD3 and loss of CpG methylation at the Alb1 enhancer accompanied the reprogramming of mouse embryonic fibroblasts (MEFs) into induced pluripotent stem (iPS) cells. Studies of two genes expressed in specific hematopoietic lineages revealed that the establishment of enhancer marks in ES cells and iPS cells can be regulated both positively and negatively. Furthermore, the absence of a pre-established mark consistently resulted in resistance to transcriptional activation in the repressive chromatin environment that characterizes differentiated cells. These results support the hypothesis that pluripotency and successful reprogramming may be critically dependent on the marking of enhancers for many or all tissue-specific genes.


Figures

Figure 1.
Figure 1.
FoxD3 regulates the Alb1 enhancer mark in ES cells. (A) FoxD3 and Oct4 protein levels were monitored by Western blot using whole-cell extracts prepared from CCE ES cells, day 7 and day 14 embryoid bodies (EBs), and VL3-3M2 thymocytes (as a negative control). β-Actin was analyzed as a loading control. (B) FoxD3 was depleted from ES cells transfected with 50 or 100 nmol of a Foxd3 siRNA pool (Dharmacon). In parallel experiments, ES cells were transfected with a nontargeting control siRNA pool (siControl; Dharmacon). At four time points after transfection, knockdown efficiency was monitored by Western blot using FoxD3 and Oct4 antibodies. HMG1 and β-actin were analyzed as controls. (C) Methylation state of the Alb1 enhancer was monitored by bisulfite sequencing. A region of a Gata1 enhancer that also contains unmethylated CpGs in ES cells was monitored as a control. Results are shown for DNA isolated at two different time points after siRNA transfection. The locations of the CpGs relative to the Alb1 or Gata1 start site are shown at the left. The percentage of plasmid clones that exhibited CpG methylation at each position in the bisulfite sequencing analysis is indicated, along with the number of methylated clones and the total number of clones analyzed (presented as a ratio). Methylation levels are represented in a gradation of colors: 0%–20% (dark green), 21%–40% (light green), 41%–60% (yellow), 61%–80% (orange), and 81%–100% (red). (D) FoxD3 and FoxA1 were overexpressed in day 14.5 MEFs by retroviral transduction. Both proteins were expressed with a Flag epitope at their C terminus. MEFs were also transduced with a control retrovirus containing an EGFP cDNA. The expression of FoxD3 and FoxA1 proteins was monitored by Western blot using an anti-Flag antibody. (E) Foxd3 and Foxa1 mRNA levels were monitored by real-time RT–PCR in uninfected ES cells, day 14.5 MEFs, and hepatocytes, as well as day 14.5 MEFs transduced with a control retrovirus or retroviruses containing Foxd3 or Foxa1 expression cassettes. (F) Bisulfite sequencing was used to examine DNA methylation at the Alb1 enhancer in untransduced MEFs and in MEFs transduced with a control retrovirus or retroviruses expressing FoxD3 or FoxA1. Results obtained with CCE ES cells are shown for comparison. (G) The sequence of the Alb1 enhancer (−10,566 to −10,895) is shown. Known transcription factor-binding sites are marked above the sequence, and CpGs are underlined.
Figure 2.
Figure 2.
Loss of methylation at an Alb1 enhancer CpG accompanies reprogramming. (A) Methylation at the Alb1 enhancer was monitored by bisulfite sequencing in primary NG2 MEFs and in two iPS lines derived from the NG2 MEFs, 1A2 resorted and 2D4. (Left) Methylation levels observed in CCE ES cells are shown for comparison. (B) Oct4 and Foxd3 mRNA levels were monitored by real-time RT–PCR in CCE ES cells, NG2 MEFs, and the 1A2 resorted and 2D4 iPS lines. (C) Foxd3, Foxa1, and Foxa2 mRNA levels were monitored by real-time RT–PCR in CCE ES cells, definitive endoderm (FoxA2+ FoxA3+) obtained by in vitro differentiation, and mature hepatocytes. Transcript levels were normalized against Gapd transcript levels. (D) A model of Alb1 gene activation during liver development is shown (see the text).
Figure 3.
Figure 3.
Reprogramming of MEFs into iPS cells is accompanied by increased susceptibility to the establishment of an unmethylated window at the Ptcra enhancer. (A) The Ptcra enhancer–promoter–reporter–insulator construct was premethylated and stably transfected into the 2D4 iPS cell line or the parental MEFs. (B) Several individual iPS and MEF clones were analyzed by bisulfite sequencing. Primers were designed to amplify only the stably integrated transgenes but not the endogenous alleles. Methylation profiles of the endogenous Ptcra enhancer in CCE ES cells, iPS 2D4, and MEF cells are also shown, along with a profile of the methylated plasmid prior to transfection.
Figure 4.
Figure 4.
Selective establishment of an unmethylated window at the Il12b enhancer. (A) A diagram of the Il12b enhancer–promoter–EGFP plasmid is shown. A 1.1-kb Il12b enhancer fragment and 0.4-kb promoter fragment were inserted upstream of a destabilized EGFP reporter (pd2EGFP). The cloned Il12b enhancer contains six CpGs (−9874 to −9420). Putative transcription factor-binding sites are shown as shaded boxes. Regions analyzed by bisulfite sequencing are indicated by double-headed arrows. (B) Methylation profiles for five iPS cell clones and four MEF clones transfected with the premethylated Il12b plasmid are shown. Methylation profiles of the endogenous Il12b enhancer in MEFs and iPS 2D4 cells, and of the premethylated Il12b plasmid prior to transfection, are also shown. (C) Methylation profiles of 10 ES cell clones, six J774 macrophage clones, and seven Hoxb8-ER myeloid progenitor cell clones transfected with premethylated Il12b plasmid are shown. Methylation profiles of the endogenous Il12b enhancer in CCE ES cells and J774 cells, and of the premethylated Il12b plasmid before transfection, are also shown.
Figure 5.
Figure 5.
Establishment of the Il12b enhancer mark in a premethylated BAC. (A) A diagram of the 191-kb Il12b-EGFP BAC is shown, along with the Il12b promoter and inducible −10-kb enhancer, 5′ untranslated exon (open box), coding exon 2 (filled box), restriction enzyme recognition sites, and EGFP cDNA insertion site. (B) Methylation profiles are shown of ES cell clones stably transfected with two different premethylated Il12b-EGFP BACs. BAC1 and BAC2 differ in the locations of short DNA sequence tags inserted near the enhancer by homologous recombination in E. coli. The tags are used to distinguish the BAC transgenes from the endogenous Il12b locus in the bisulfite sequencing experiments. As controls, the methylation profiles of the premethylated BAC DNAs prior to transfection are shown. For comparison, the methylation profiles of the endogenous Il12b enhancer in CCE and J1 ES cells are shown at the left. (C) The strategy used to differentiate ES cell clones containing premethylated Il12b-EGFP BACs into macrophages is diagrammed. (D) GFP expression in ES cell-derived macrophages (ESDM) generated from several clonal ES cell lines containing a premethylated Il12b-EGFP BAC was measured by flow cytometry before stimulation (NS) and after stimulation with LPS + IFN-γ.
Figure 6.
Figure 6.
Mi-2β contributes to the repressive chromatin environment in differentiated cells. (A) Ac-H3K9 and 3Me-H3K4 levels, as well as RNA polymerase II levels, were examined by ChIP at the Ptcra enhancer within stably integrated Ptcra enhancer–promoter–reporter–insulator plasmids (construct F2R2) in VL3-3M2 thymocytes. Four independent clones generated by stable transfection with the premethylated plasmid (M2–M5) and two clones generated by stable transfection with the unmethylated plasmid (Unmet. 5 and Unmet. 34) were examined. Precipitated DNA samples were amplified using primers specific to the Ptcra enhancer region within the integrated plasmid. The ChIP signals are shown as a percentage of the input DNA signal and are representative of three independent experiments. (B) The experimental strategy used to examine the effect of Mi-2β or Brg1/Brm knockdown on DNA methylation at the integrated Ptcra enhancer is diagrammed. (C) Western blots were performed to examine the efficiency of Mi-2β and Brg1 knockdown after retroviral transduction of constructs expressing specific shRNAs. Extracts were examined from cells that were left untransduced (WT) or were transduced with a control retrovirus (Control, no shRNA cassette) or retroviruses expressing shRNAs specific for Mi-2β or Brg1/Brm (BBM2) transcripts. Retroviral transduction was performed with two independent VL3-3M2 clones containing the premethylated Ptcra enhancer–promoter–reporter–insulator plasmid (F2R2-M2 and F2R2-M3). GAPDH was analyzed as a loading control. (D) Bisulfite sequencing was used to examine DNA methylation at the integrated Ptcra enhancer 4 d after retroviral transduction of the F2R2-M2 and F2R2-M3 VL3-3M2 clones. DNA was examined from untransduced cells (WT) or cells transduced with the control retrovirus (Control) or the retroviruses expressing the Mi-2β or Brg1/Brm (BBM2) shRNAs. DNA methylation was examined at the integrated Ptcra enhancer and promoter, as well as at CpGs located upstream of (UP) or downstream from (DN) the enhancer. (E) EGFP mRNA expression from the F2R2-M2 and F2R2-M3 clones was examined by real-time RT–PCR. As a control, EGFP mRNA levels were monitored in two different clones (5 and 34) transfected with the unmethylated Ptcra enhancer–promoter–reporter–insulator plasmid. Gapd mRNA levels were monitored in each sample as a control.
Figure 7.
Figure 7.
Dynamic regulation of the unmethylated window within the Ptcra enhancer in ES cells. (A) A diagram of the Ptcra enhancer–promoter–EGFP–insulator plasmid is shown. The 0.37-kb Ptcra enhancer and the 0.5-kb promoter were inserted upstream of a destabilized EGFP reporter (pd2EGFP). The cloned Ptcra enhancer contains seven CpG dinucleotides (−4130 to −3900). Putative transcription factor-binding sites are shown as shaded boxes. Regions analyzed by deletion and substitution mutation are indicated by a dashed line and double-headed arrows, respectively. (B–H) Ptcra enhancer methylation was monitored by bisulfite sequencing in several independent stable clones containing the wild-type enhancer (B) or six different mutant enhancers (C–H). Other mutations that had no effect on establishment of an unmethylated window are shown in Supplemental Figures 4 and 5. (I,J) A working model for the positive and negative regulation of DNA methylation at the Ptcra enhancer mark in pluripotent cells and thymocytes is shown.

Comment in

Similar articles

Cited by

References

    1. Bernstein BE, Mikkelsen TS, Xie X, Kamal M, Huebert DJ, Cuff J, Fry B, Meissner A, Wernig M, Plath K, et al. A bivalent chromatin structure marks key developmental genes in embryonic stem cells. Cell. 2006;125:315–326. - PubMed
    1. Bird A, Macleod D. Reading the DNA methylation signal. Cold Spring Harb Symp Quant Biol. 2004;69:113–118. - PubMed
    1. Bossard P, Zaret KS. GATA transcription factors as potentiators of gut endoderm differentiation. Development. 1998;125:4909–4917. - PubMed
    1. Boyer LA, Lee TI, Cole MF, Johnstone SE, Levine SS, Zucker JP, Guenther MG, Kumar RM, Murray HL, Jenner RG, et al. Core transcriptional regulatory circuitry in human embryonic stem cells. Cell. 2005;122:947–956. - PMC - PubMed
    1. Boyer LA, Plath K, Zeitlinger J, Brambrink T, Medeiros LA, Lee TI, Levine SS, Wernig M, Tajonar A, Ray MK, et al. Polycomb complexes repress developmental regulators in murine embryonic stem cells. Nature. 2006;441:349–353. - PubMed

Publication types

Substances