. 2010 Jan;51(1):57-65.
doi: 10.2967/jnumed.109.065185. Epub 2009 Dec 15.

Spatial heterogeneity of lung perfusion assessed with (13)N PET as a vascular biomarker in chronic obstructive pulmonary disease

Affiliations

Spatial heterogeneity of lung perfusion assessed with (13)N PET as a vascular biomarker in chronic obstructive pulmonary disease

Marcos F Vidal Melo et al. J Nucl Med. 2010 Jan.

Abstract

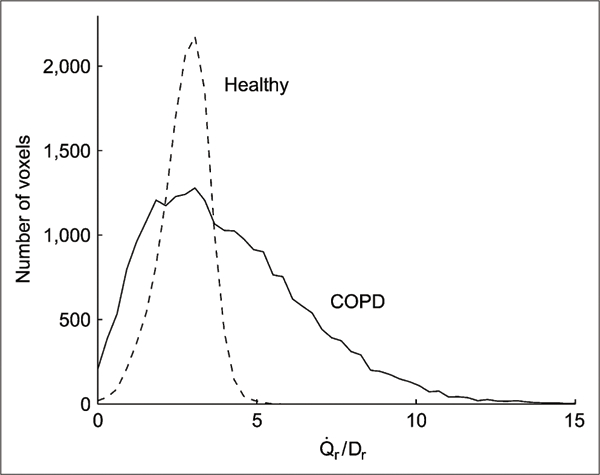
Although it is known that structural and functional changes in the pulmonary vasculature and parenchyma occur in the progress of chronic obstructive pulmonary disease (COPD), information is limited on early regional perfusion (Q(r)) alterations.

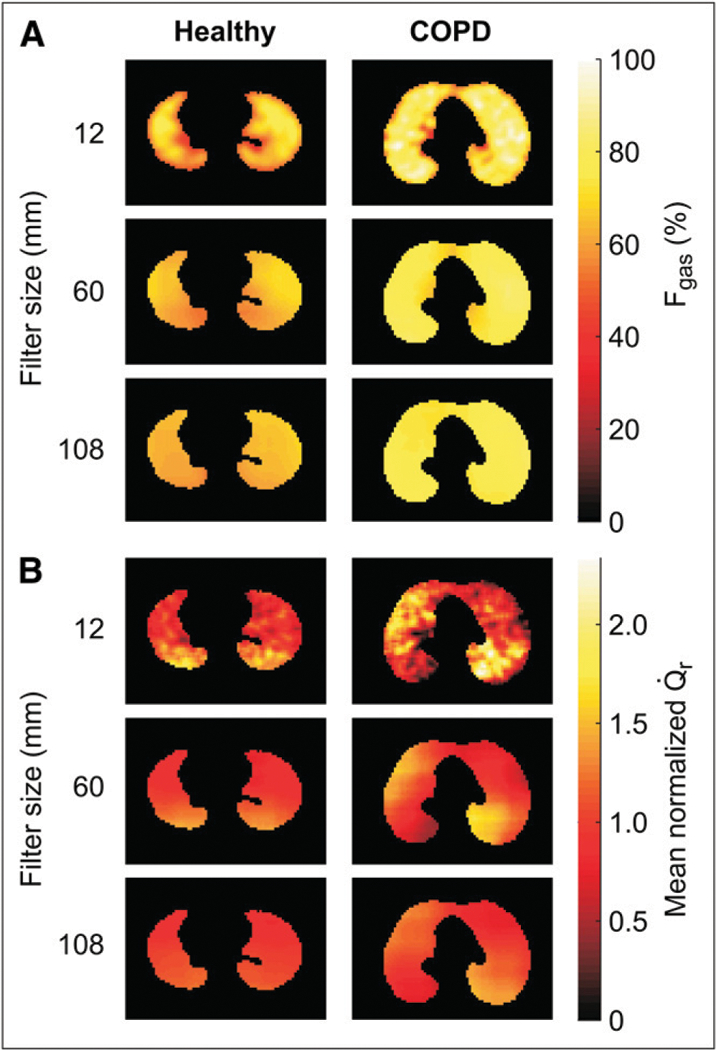
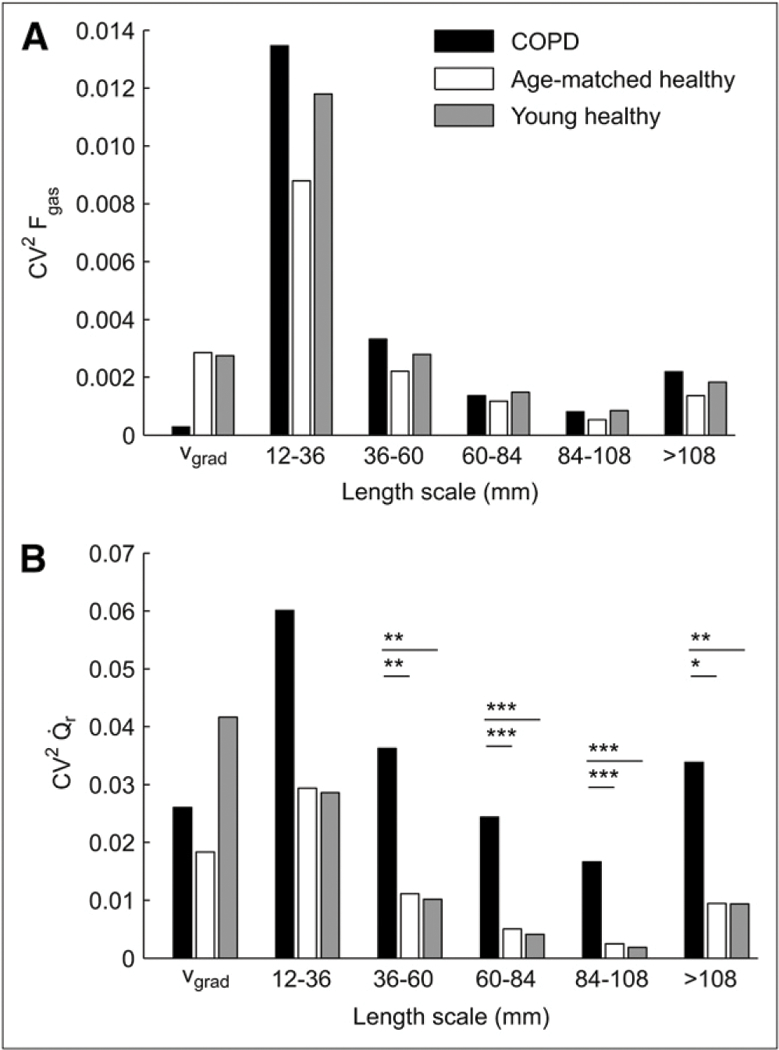
Methods: We studied 6 patients with mild or moderate COPD and 9 healthy subjects (6 young and 3 age-matched). The PET (13)NN-labeled saline injection method was used to compute images of Q(r) and regional ventilation (V(r)). Transmission scans were used to assess regional density. We used the squared coefficient of variation to quantify Q(r) heterogeneity and length-scale analysis to quantify the contribution to total perfusion heterogeneity of regions ranging from less than 12 to more than 108 mm.

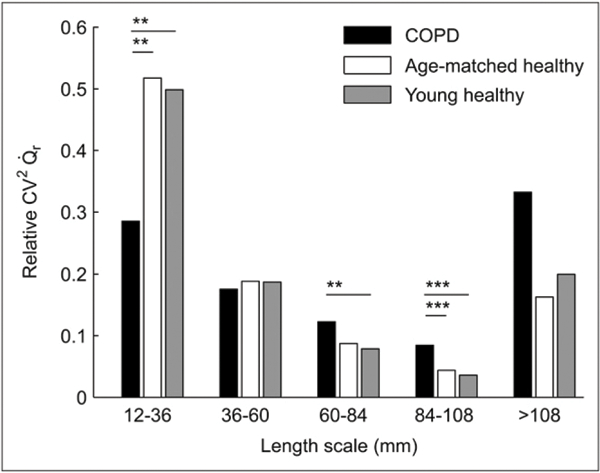
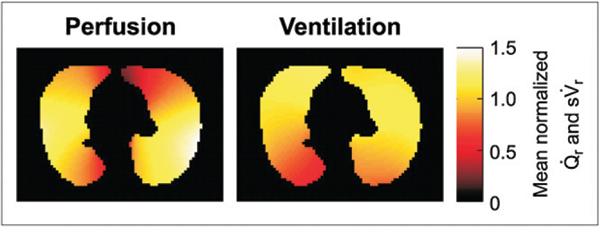
Results: Perfusion distribution in COPD subjects showed larger Q(r) heterogeneity, higher contribution from large length scales and lower contribution from small length scales, and larger heterogeneity of Q(r) normalized by tissue density than did healthy subjects. Dorsoventral gradients of V(r) were present in healthy subjects, with larger ventilation in dependent regions, whereas no gradient was present in COPD. Heterogeneity of ventilation-perfusion ratios was larger in COPD.

Conclusion: Q(r) is significantly redistributed in COPD. Q(r) heterogeneity in COPD patients is greater than in healthy subjects, mainly because of the contribution of large lung regions and not because of changes in tissue density or V(r). The assessment of spatial heterogeneity of lung perfusion with (13)NN-saline PET may serve as a vascular biomarker in COPD.


Figures

FIGURE 1.
FIGURE 1.
Representative PET images of regional Fgas (A) and mean normalized perfusion (Q.r) (B) in supine young healthy and COPD subjects for different topographic filter sizes. Images are transverse tomographic sections, with color scale representing either Fgas (A) or 13NN activity (B). Left side in image corresponds to left lung. Heterogeneity is present in Q.r but not Fgas for COPD subjects at larger filter sizes, indicating large length-scale heterogeneity.
FIGURE 2.
FIGURE 2.
Squared coefficient of variation (CV2) of regional Fgas (A) and mean normalized perfusion (Q.r) (B) pertaining to different length-scale ranges and vertical gradient (vgrad) in 3 groups studied: young healthy subjects (n = 6), age-matched healthy subjects (n = 3), and COPD subjects (n = 6). CV2Fgas was similar among all groups at each length scale. In contrast, CV2Q.r heterogeneity was larger in COPD subjects than in healthy subjects for all length scales. CV2Q.r was similar at each length scale for groups of healthy subjects. *0.05 < P < 0.10. **P < 0.05. ***P < 0.005.
FIGURE 3.
FIGURE 3.
Percentage contribution of length-scale ranges to perfusion heterogeneity (relative CV2Q.r) in 3 groups studied: young healthy subjects (n = 6), age-matched healthy subjects (n = 3), and COPD subjects (n = 6). Contribution of lower length-scale heterogeneity is greater in both normal groups, in contrast to greater contribution of large length-scale heterogeneity in COPD. **P < 0.05. ***P < 0.005.
FIGURE 4.
FIGURE 4.
PET image of mean normalized Q.r and sV.r filtered to length scales greater than 108 mm in COPD patient. Large length-scale heterogeneity is present in both images, but there is no full topographic matching between them.
FIGURE 5.
FIGURE 5.
Histograms of mean normalized Q˙r/Dr ratios for whole imaged lung field in typical young healthy subject and COPD patient. Larger heterogeneity of Q˙r/Dr ratio exists in COPD patient.

Similar articles

Cited by

References

    1. Goddard PR, Nicholson EM, Laszlo G, Watt I. Computed tomography in pulmonary emphysema. Clin Radiol. 1982;33:379–387. - PubMed
    1. Wagner PD, Dantzker DR, Dueck R, Clausen JL, West JB. Ventilation-perfusion inequality in chronic obstructive pulmonary disease. J Clin Invest. 1977;59:203–216. - PMC - PubMed
    1. West JB. Distribution of mechanical stress in the lung, a possible factor in localisation of pulmonary disease. Lancet. 1971;1:839–841. - PubMed
    1. Weitzenblum E, Hirth C, Ducolone A, Mirhom R, Rasaholinjanahary J, Ehrhart M. Prognostic value of pulmonary artery pressure in chronic obstructive pulmonary disease. Thorax. 1981;36:752–758. - PMC - PubMed
    1. Wright JL, Levy RD, Churg A. Pulmonary hypertension in chronic obstructive pulmonary disease: current theories of pathogenesis and their implications for treatment. Thorax. 2005;60:605–609. - PMC - PubMed

Publication types

MeSH terms