. 2010 Jan;51(1):112-20.
doi: 10.2967/jnumed.109.067074. Epub 2009 Dec 15.

Imaging and quantitation of cannabinoid CB1 receptors in human and monkey brains using (18)F-labeled inverse agonist radioligands

Affiliations

Imaging and quantitation of cannabinoid CB1 receptors in human and monkey brains using (18)F-labeled inverse agonist radioligands

Garth E Terry et al. J Nucl Med. 2010 Jan.

Abstract

We recently demonstrated that (11)C-MePPEP, a PET ligand for CB(1) receptors, has such high uptake in the human brain that it can be imaged for 210 min and that receptor density can be quantified as distribution volume (V(T)) using the gold standard of compartmental modeling. However, (11)C-MePPEP had relatively poor retest and intersubject variabilities, which were likely caused by errors in the measurements of radioligand in plasma at low concentrations by 120 min. We sought to find an analog of (11)C-MePPEP that would provide more accurate plasma measurements. We evaluated several promising analogs in the monkey brain and chose the (18)F-di-deutero fluoromethoxy analog ((18)F-FMPEP-d(2)) to evaluate further in the human brain.

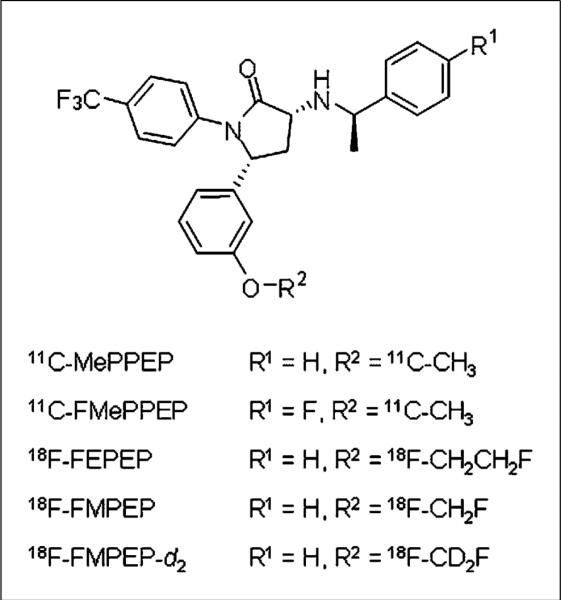
Methods: (11)C-FMePPEP, (18)F-FEPEP, (18)F-FMPEP, and (18)F-FMPEP-d(2) were studied in 5 monkeys with 10 PET scans. We calculated V(T) using compartmental modeling with serial measurements of unchanged parent radioligand in arterial plasma and radioactivity in the brain. Nonspecific binding was determined by administering a receptor-saturating dose of rimonabant, an inverse agonist at the CB(1) receptor. Nine healthy human subjects participated in 17 PET scans using (18)F-FMPEP-d(2), with 8 subjects having 2 PET scans to assess retest variability. To identify sources of error, we compared intersubject and retest variability of brain uptake, arterial plasma measurements, and V(T).

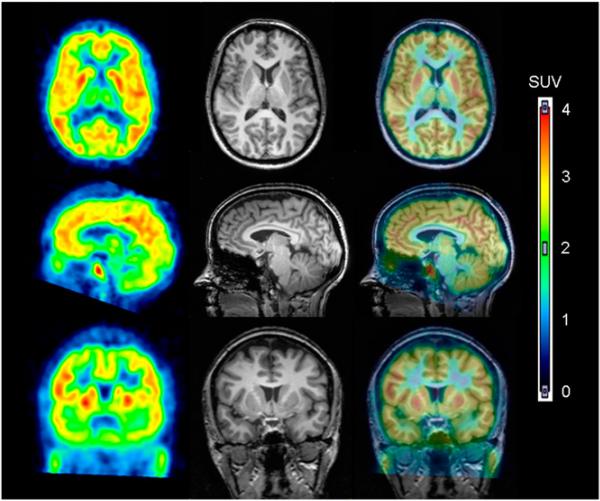
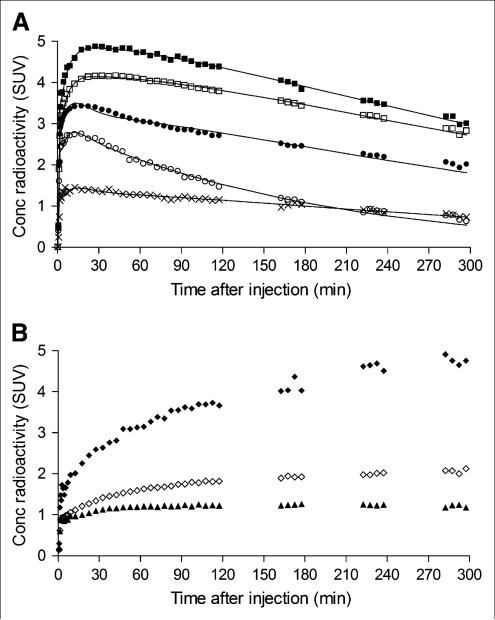
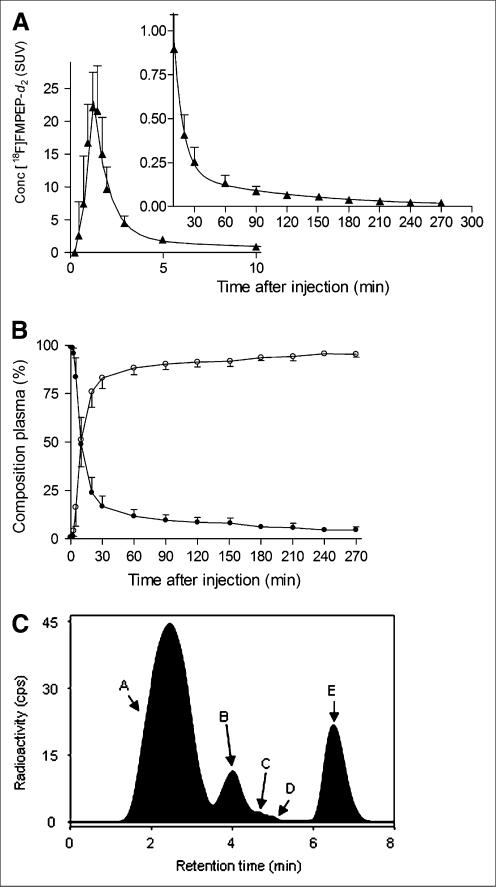
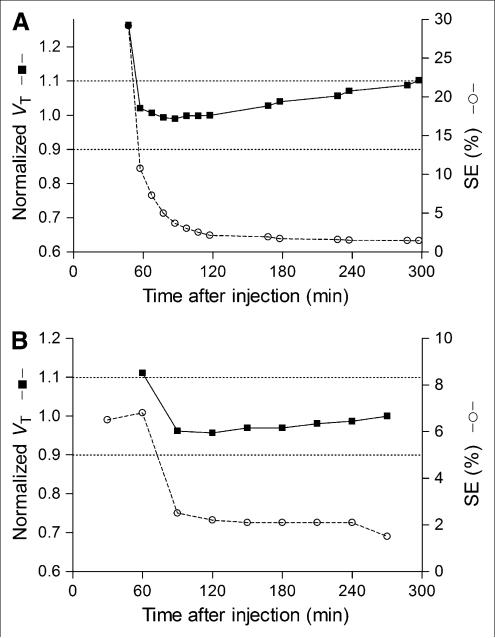
Results: (18)F-FMPEP-d(2) had high uptake in the monkey brain, with greater than 80% specific binding, and yielded less radioactivity uptake in bone than did (18)F-FMPEP. High brain uptake with (18)F-FMPEP-d(2) was also observed in humans, in whom V(T) was well identified within approximately 60 min. Retest variability of plasma measurements was good (16%); consequently, V(T) had a good retest variability (14%), intersubject variability (26%), and intraclass correlation coefficient (0.89). V(T) increased after 120 min, suggesting an accumulation of radiometabolites in the brain. Radioactivity accumulated in the skull throughout the entire scan but was thought to be an insignificant source of data contamination.

Conclusion: Studies in monkeys facilitated our development and selection of (18)F-FMPEP-d(2), compared with (18)F-FMPEP, as a radioligand demonstrating high brain uptake, high percentage of specific binding, and reduced uptake in bone. Retest analysis in human subjects showed that (18)F-FMPEP-d(2) has greater precision and accuracy than (11)C-MePPEP, allowing smaller sample sizes to detect a significant difference between groups.


Figures

FIGURE 1
FIGURE 1
Structure of 11C-MePPEP and its analogs.
FIGURE 2
FIGURE 2
18F-FMPEP-d2 in human brain. PET images from 30 to 60 min after injection of 18F-FMPEP-d2 were averaged (left column) and coregistered to subject's MR images (middle column). PET and MR images are overlaid in right column.
FIGURE 3
FIGURE 3
Time–activity curves of 18F-FMPEP-d2 in brain from single subject scanned for 300 min. (A) Decay-corrected measurements from putamen (■), prefrontal cortex (□), cerebellum (•, pons (○), and white matter (×) were fitted with unconstrained 2-tissue-compartment model (–). Putamen was consistently region of highest brain uptake. White matter was consistently region of lowest brain uptake, followed by pons. (B) Decay-corrected measurements from same subject demonstrate uptake of radioactivity in clivus (◆), occiput (◇), and parietal bones (▲). Concentration (Conc) is expressed as SUV, which normalizes for injected activity and body weight.
FIGURE 4
FIGURE 4
Concentration of 18F-FMPEP-d2 and its percentage composition in arterial plasma. (A) Average concentration of 18F-FMPEP-d2 in arterial plasma from 9 subjects is plotted over time after injection. Data after peak (~1 min) were fitted to triexponential curve (—). Symbols (▲) and error bars represent mean and SD, respectively. (B) Percentage composition of parent radioligand (•) and radiometabolites (○) in arterial plasma from 9 subjects are plotted over time after injection. After 60 min, 18F-FMPEP-d2 accounted for at least 11% of radioactivity in arterial plasma. (C) This radiochromatogram illustrates plasma composition from 1 subject, 30 min after injection of 18F-FMPEP-d2. Radioactivity was measured in counts per second (cps). Peaks are labeled with increasing lipophilicity from A to E. Peak E represents 18F-FMPEP-d2. Conc = concentration.
FIGURE 5
FIGURE 5
VT of putamen and its identifiability as function of duration of image acquisition (A) and plasma measurements (B). VT (■) was calculated using unconstrained 2-tissue-compartment model. Values were normalized to that determined from 120 min of imaging and are plotted with y-axis on left. Corresponding SE (○), which is inversely proportional to identifiability, is plotted with y-axis on right. Points represent average of 9 subjects. (A) Length of image acquisition was varied from 0–30 to 0–300 min, but entire input function (0–270 min) was used for all calculations. VT was stably identified between 60 and 120 min but gradually increased thereafter. (B) Length of plasma input function was varied from 0–270 to 0–60 min, but initial 120 min of image acquisitions were used for all calculations. VT was stably identified with as little as initial 90 min of plasma data.
FIGURE 6
FIGURE 6
Simulated changes in brain uptake with variations of receptor density. Average individual kinetic parameters from prefrontal cortex were used to simulate expected changes in brain uptake at 280–300 (○), 0–300 (•), 90–120 (□), and (▲) 20–60 min. Changes in receptor density were simulated by varying value of k3 from its mean value (set at 100% on x-axis). As expected, value of VT (shown by line that has y-intercept equal to K1/k2) is directly proportional to changes in k3.

Similar articles

Cited by

References

    1. Van Laere K. In vivo imaging of the endocannabinoid system: a novel window to a central modulatory mechanism in humans. Eur J Nucl Med Mol Imaging. 2007;34:1719–1726. - PubMed
    1. Terry GE, Liow JS, Zoghbi SS, et al. Quantitation of cannabinoid CB1 receptors in healthy human brain using positron emission tomography and an inverse agonist radioligand. Neuroimage. 2009;48:362–370. - PMC - PubMed
    1. Donohue SR, Krushinski JH, Pike VW, et al. Synthesis, ex vivo evaluation, and radiolabeling of potent 1,5-diphenylpyrrolidin-2-one cannabinoid subtype-1 receptor ligands as candidates for in vivo imaging. J Med Chem. 2008;51:5833–5842. - PMC - PubMed
    1. Hashimoto K, Inoue O, Suzuki K, Yamasaki T, Kojima M. Deuterium isotope effect of [11C1]N,N-dimethylphenethyl-amine-a,a-d2; reduction in metabolic trapping rate in brain. Int J Rad Appl Instrum B. 1986;13:79–80. - PubMed
    1. Schou M, Halldin C, Sovago J, et al. PET evaluation of novel radiofluorinated reboxetine analogs as norepinephrine transporter probes in the monkey brain. Synapse. 2004;53:57–67. - PubMed

Publication types

MeSH terms

Substances

LinkOut - more resources