. 2010 Mar;298(3):E489-98.
doi: 10.1152/ajpendo.00361.2009. Epub 2009 Dec 15.

Early exposure of the pregestational intrauterine and postnatal growth-restricted female offspring to a peroxisome proliferator-activated receptor-{gamma} agonist

Affiliations

Early exposure of the pregestational intrauterine and postnatal growth-restricted female offspring to a peroxisome proliferator-activated receptor-{gamma} agonist

Meena Garg et al. Am J Physiol Endocrinol Metab. 2010 Mar.

Abstract

Prenatal nutrient restriction with intrauterine growth restriction (IUGR) alters basal and glucose-stimulated insulin response and hepatic metabolic adaptation. The effect of early intervention with insulin-sensitizing peroxisome proliferator-activated receptor gamma agonists was examined in the metabolically maladapted F(1) pregestational IUGR offspring with a propensity toward pregnancy-induced gestational diabetes. The effect of rosiglitazone maleate [RG; 11 micromol/day from postnatal day (PN) 21 to PN60] vs. placebo (PL) on metabolic adaptations in 2-mo-old F(1) female rats subjected to prenatal (IUGR), postnatal (PNGR), or pre- and postnatal (IUGR + PNGR) nutrient restriction was investigated compared with control (CON). RG vs. PL had no effect on body weight or plasma glucose concentrations but increased subcutaneous white and brown adipose tissue and plasma cholesterol concentrations in all three experimental groups. Glucose tolerance tests with a 1:1 mixture of [2-(2)H(2)]- and [6,6-(2)H(2)]glucose in RG IUGR vs. PL IUGR revealed glucose tolerance with a lower glucose-stimulated insulin release (GSIR) and suppressed endogenous hepatic glucose production (HGP) with no difference in glucose clearance (GC) and recycling (GR). RG PNGR, although similar to PL CON, was hyperglycemic vs. PL PNGR with reduced GR but no difference in the existent low GSIR, HGP, and GC. RG IUGR + PNGR overall was no different from the PL counterpart. Insulin tolerance tests revealed perturbed recovery to baseline from the exaggerated hypoglycemia in RG vs. the PL groups with the only exception being RG PNGR where further worsening of hypoglycemia over PL PNGR was minimal with full recovery to baseline. These observations support that early intervention with RG suppressed HGP in IUGR vs. PL IUGR, without increasing GSIR similar to that seen in CON. Although RG reversed PNGR to the PL CON metabolic state, no such insulin-sensitizing effect was realized in IUGR + PNGR.


Figures
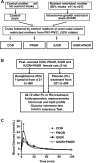
Fig. 1.
Fig. 1.
A: study design demonstrating the control group and nutrient restriction achieved by cross-fostering postnatal rat pups. Nutrient-restricted mothers received 50% of daily nutrient intake from mid to late pregnancy {embryonic (e) day 11 to 21 through lactation [postnatal (PN) day 1 to day 21]}. B: experimental protocol for intervention with rosiglitazone (RG) or placebo (PL) from PN21 to PN60 and the studies performed on PN60. C: gestational glucose tolerance test (GTT) in 18 days pregnant animals showing blood glucose concentrations at all time points. *P < 0.05 vs. control (CON), n = 4 rats/group.
Fig. 2.
Fig. 2.
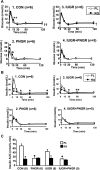
A: plasma glucose concentrations at all time points during GTT in PL- and RG-treated groups. 1, CON; 2, postnatal growth restriction (PNGR); 3, intrauterine growth restriction (IUGR); and 4, IUGR + PNGR. *P < 0.0001 and **P < 0.006, RG vs. PL is significantly higher. †P < 0.02 ad ††P < 0.0001, RG vs. PL is significantly lower. B: plasma insulin concentrations at all time points during GTT in PL- and RG-treated groups. 1, CON; 2, PNGR; 3, IUGR; and 4, IUGR + PNGR. The scale of the ordinate was adjusted to show the lower values in PNGR and IUGR + PNGR groups. Holm-Sidak test shows a significant decrease in RG CON and RG IUGR vs. corresponding PL groups: *P < 0.0001 **P < 0.004, and ♦P < 0.001. C: area under the curve (AUC) for plasma insulin concentration during GTT. Two-way ANOVA revealed a significant effect of RG treatment (F = 34.512, P < 0.001), early nutrition (F = 12.729, P < 0.001), and RG treatment × early nutrition (F = 12.139, P < 0.001). Holm-Sidak test revealed significant decrease in insulin AUC for RG CON and RG IUGR vs. the corresponding PL group (*P < 0.0001) and ♦P < 0.0001 for PL PNGR and PL IUGR + PNGR vs. the PL CON.
Fig. 3.
Fig. 3.
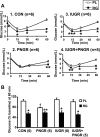
A: glucose concentrations during the insulin tolerance tests in PL and RG groups. 1, CON; 2, PNGR; 3, IUGR; and 4, IUGR + PNGR. *P < 0.001, **P < 0.002, and ***P < 0.005, RG vs. the corresponding PL groups by Holm-Sidak test. B: blood glucose 60 min after insulin injection shown as %baseline for all PL and RG groups. Two-way ANOVA revealed a significant effect of RG treatment (F = 125.2, P < 0.001), early nutrition (F = 3.362, P < 0.03), and RG treatment × early nutrition (F = 4.434, P < 0.01). *P < 0.0001 and **P < 0.01, RG vs. the corresponding PL groups and P < 0.01 PL-PNGR vs. PL-CON by Holm-Sidak test.
Fig. 4.
Fig. 4.
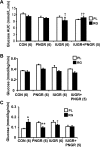
A: AUC for endogenous hepatic glucose production during GTT in all PL and RG groups. Two-way ANOVA revealed a significant effect of early nutrition alone (F = 5.124, P < 0.004), but no effect of RG treatment alone (F = 1.923, P < 0.174), or early nutrition × early nutrition (F = 2.547, P < 0.07). Holm-Sidak test demonstrated *P < 0.02 in RG vs. the corresponding PL group, †P < 0.007 for RG IUGR vs. RG CON and PL CON, and ††P < 0.02 compared with PL CON. B: total glucose clearance (mmol·kg−1·min−1) during GTT in all PL- and RG-treated groups. Two-way ANOVA demonstrated a significant effect of RG treatment (F = 8.742, P < 0.005) and early nutrition (F = 3.428, P < 0.02), but no effect of RG × early nutrition (F = 0.402, P < 0.753). C: hepatic glucose recycling or glucose futile cycling during GTT in all PL and RG groups. Two-way ANOVA demonstrated a significant effect of RG treatment × early nutrition (F = 4.084, P < 0.013), but no effect of RG treatment (F = 0.313, P < 0.579) or early nutrition (F = 1.161, P < 0.337) alone. Holm-Sidak test demonstrated **P < 0.02 and *P < 0.03, RG vs. the respective PL group. †P < 0.0001 by Dunn's test with Bonferroni correction.

Similar articles

Cited by

References

    1. Aaboe K, Krarup T, Madsbad S, Holst JJ. GLP-1: physiological effects and potential therapeutic applications. Diabetes Obes Metab 10: 994–1003, 2008 - PubMed
    1. Barker DJ. Adult consequences of fetal growth restriction. Clin Obstet Gynecol 49: 270–283, 2006 - PubMed
    1. Barker DJ, Osmond C, Forsen TJ, Kajantie E, Eriksson JG. Trajectories of growth among children who have coronary events as adults. N Engl J Med 353: 1802–1809, 2005 - PubMed
    1. Bazaes RA, Mericq V. Premature birth and insulin resistance. N Engl J Med 352: 939–940, 2005 - PubMed
    1. Blondeau B, Avril I, Duchene B, Breant B. Endocrine pancreas development is altered in foetuses from rats previously showing intra-uterine growth retardation in response to malnutrition. Diabetologia 45: 394–401, 2002 - PubMed

Publication types