Comparative Study
. 2010 Feb;24(2):423-35.
doi: 10.1210/me.2009-0343. Epub 2009 Dec 15.

Plasma membrane expression of gonadotropin-releasing hormone receptors: regulation by peptide and nonpeptide antagonists

Affiliations
Comparative Study

Plasma membrane expression of gonadotropin-releasing hormone receptors: regulation by peptide and nonpeptide antagonists

Ann R Finch et al. Mol Endocrinol. 2010 Feb.

Abstract

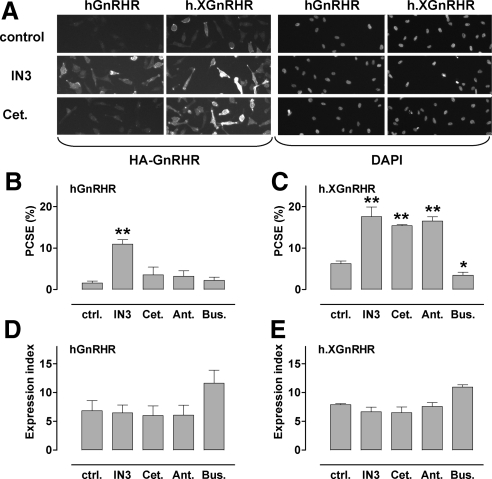
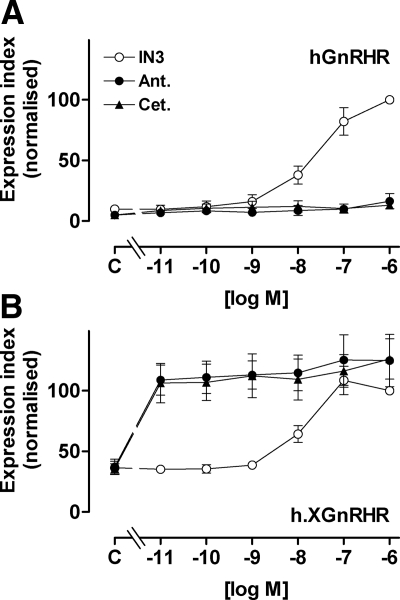
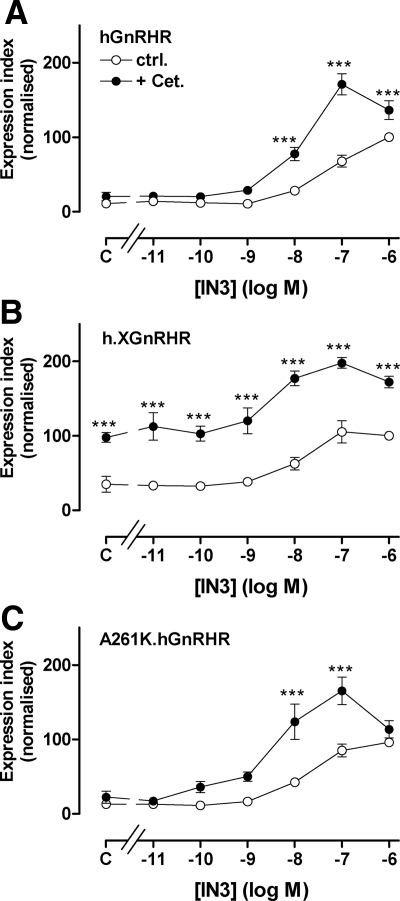
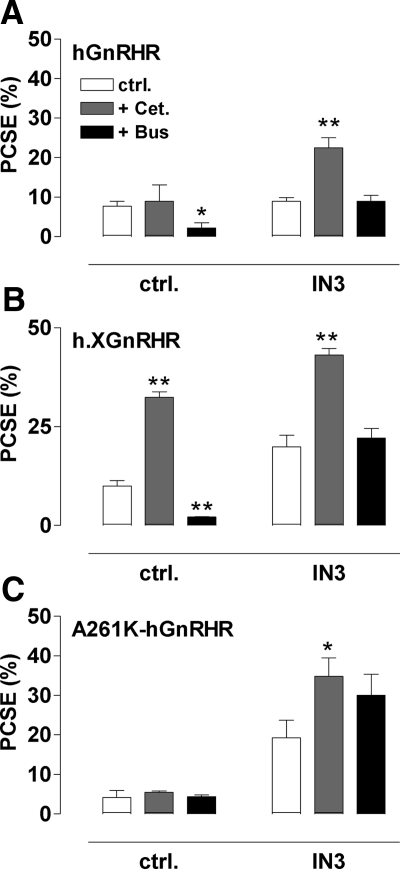
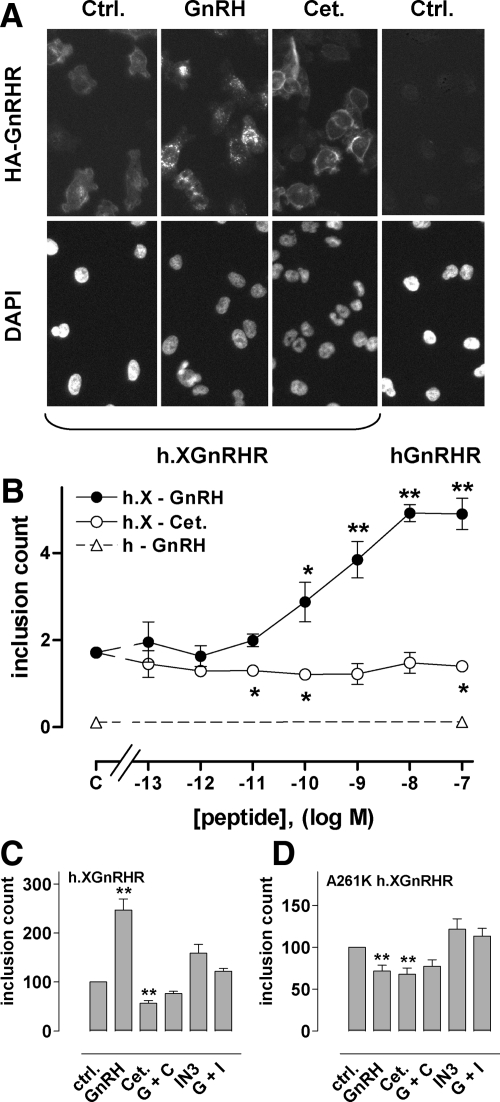
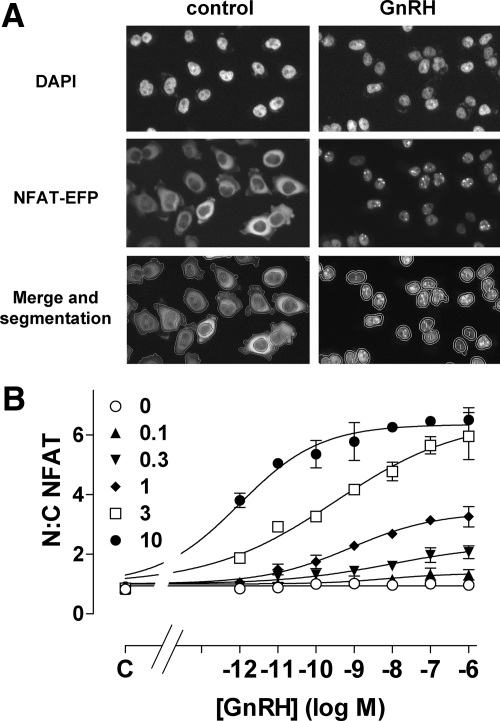
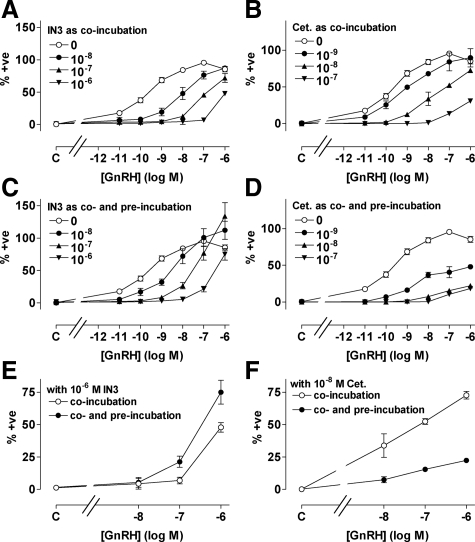
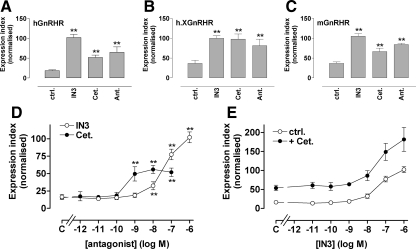
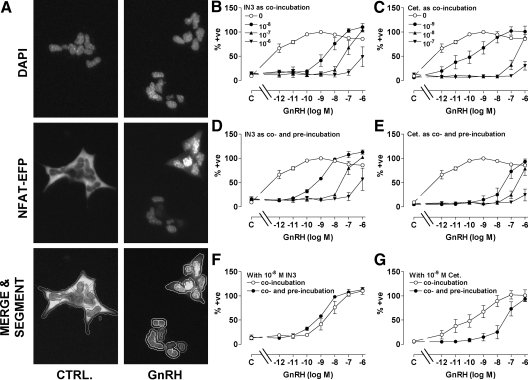
Gonadotropin-releasing hormone acts via cell surface receptors but most human (h) GnRH receptors (GnRHRs) are intracellular. A membrane-permeant nonpeptide antagonist [(2S)-2-[5-[2-(2-axabicyclo[2.2.2]oct-2-yl)-1,1-dimethy-2-oxoethyl]-2-(3,5-dimethylphenyl)-1H-indol-3-yl]-N-(2-pyridin-4-ylethyl)propan-1-amine (IN3)] increases hGnRHR expression at the surface, apparently by facilitating its exit from the endoplasmic reticulum. Here we have quantified GnRHR by automated imaging in HeLa cells transduced with adenovirus expressing hemagglutinin-tagged GnRHR. Consistent with an intracellular site of action, IN3 increases cell surface hGnRHR, and this effect is not blocked or mimicked by membrane-impermeant peptide antagonists [Ac-D2Nal-D4Cpa-D3Pal-Ser-Tyr-d-Cit-Leu-Arg-Pro-d-Ala-NH(2) (cetrorelix) and antide]. However, when the C-terminal tail of a Xenopus (X) GnRHR was added (h.XGnRHR) to increase expression, both peptides further increased cell surface GnRHR. Cetrorelix also synergized with IN3 to increase expression of hGnRHR and a G-protein coupling-deficient mutant (A261K-hGnRHR). Cetrorelix also increased cell surface expression of hGnRHR, h.XGnRHR, and mouse GnRHR in gonadotrope-lineage LbetaT2 cells, and in HeLa cells it slowed h.XGnRHR internalization (measured by receptor-mediated antihemagglutinin uptake). Thus cetrorelix has effects other than GnRHR blockade; it acts as an inverse agonist in internalization assays, supporting the potential importance of ligand-biased efficacy at GnRHR. We also developed an imaging assay for GnRH function based on Ca(2+)-dependent nuclear translocation of a nuclear factor of activated T cells reporter. Using this in HeLa and LbetaT2 cells, IN3 and cetrorelix behaved as competitive antagonists when coincubated with GnRH, and long-term pretreatment (16 h) with IN3 reduced its effectiveness as an inhibitor whereas pretreatment with cetrorelix increased its inhibitory effect. This distinction between peptide and nonpeptide antagonists may prove important for therapeutic applications of GnRH antagonists.


Figures

Figure 1
Figure 1
Quantification of HA-GnRHR in HeLa cells by automated imaging. HeLa cells transduced with HA-tagged hGnRHR or h.XGnRHR (1 pfu/nl) were incubated 18 h with IN3, cetrorelix (Cet.), antide (Ant.), or buserelin (Bus.) each at (10−6 m), or no addition (control). They were then stained before image acquisition and analysis as described in the Materials and Methods. Panel A contains representative stains from a proportion (∼10%) of fields showing cell-surface HA-GnRHR or DAPI (nuclear) staining in control and IN3- or cetrorelix-treated cells as indicated. Automated algorithms were used to define cell perimeters, EI, and PCSE values. Panels B and C show PCSE values; panels D and E show whole-cell EI values in arbitrary fluorescence units, each pooled from three experiments with triplicate or quadruplicate wells (mean ± sem; n = 3). *, P < 0.05; **, P < 0.01. ctrl., Control.
Figure 2
Figure 2
Concentration dependence of peptide and nonpeptide antagonists effects on GnRHR expression. HeLa cells were treated as in Fig. 1 except that they were incubated for 18 h with 10−11 to 10−6 m IN3, antide (Ant.), or cetrorelix (Cet.) or without antagonist (C, control) before staining for HA-tagged hGnRHR and h.XGnRHR at the cell surface. The data are cell-surface EI normalized a percent of the value obtained for each receptor in the presence of 10−7 m IN3, and are means ± sems (n = 3–7) from seven experiments, each with triplicate wells. The normalized values were significantly greater than control (P < 0.05) for IN3 at 10−8, 10−7, and 10−6 m (at both receptors) and for all concentrations of peptide antagonists at the h.XGnRHR (panel B), whereas the peptides did not increase expression of the hGnRHR at any concentration (P > 0.05, panel A).
Figure 3
Figure 3
Interaction between peptide and nonpeptide antagonist effects on GnRHR expression index. HeLa cells were treated as for Fig. 1 except that they were transduced with HA-tagged hGnRHR (panel A), h.XGnRHR (panel B), or A261K.hGnRHR (panel C) and then incubated 18 h in medium with 10−11 to 10−6 m IN3 or without IN3 (C, control) with 0 (ctrl.) or 10−7 m cetrorelix (Cet.) before staining. The data shown are the cell-surface EI normalized as a percent of the value for each receptor in the presence of 10−6 m IN3 and are means ± sem (n = 3–6) from six experiments, each with triplicate wells. Two-way ANOVAs revealed that IN3, cetrorelix, and the interaction between them were all significant variables with all three receptors (P < 0.001), and post hoc tests revealed significant differences between effects with and without cetrorelix (***, P < 0.001). Two-way ANOVA of data with 0 or 10−7 m cetrorelix data subtracted (i.e. analysis of the IN3-induced increment alone) also revealed that IN3, cetrorelix, and the interaction between them as significant variables (P < 0.001). Synergism between the antagonists is further evidenced by the fact that the increase in hGnRHR expression caused by 10−8 and 10−7m IN3 was greater in the presence of cetrorelix than in its absence for hGnRHR and A261K.hGnRHR (P < 0.05). ctrl., Control.
Figure 4
Figure 4
Interaction between peptide and nonpeptide antagonist effects on GnRHR PCSE. Cells transduced with hGnRHR, h.XGnRHR, or A261K-hGnRHR (panels A–C, respectively) were treated as in Fig. 3 except that incubations were with 0 (ctrl.) or 10−8 m IN3, either alone (ctrl.) or with 10−7 m cetrorelix (Cet.) or buserelin (Bus.). Whole-cell and cell-surface EI values were determined, enabling calculation of the PCSE values (as above). The data shown are means ± sem (n = 3) from three separate experiments each with triplicate wells. *, P < 0.05; **, P < 0.01 compared with the appropriate receptor and IN3-matched control. ctrl., Control.
Figure 5
Figure 5
Effects of agonists and antagonists on HA-GnRHR internalization. Panel A, HeLa cells transduced with HA-tagged hGnRHR or h.XGnRHR were loaded with anti-HA at 21 C, and then washed and incubated for 60 min at 37 C in medium with the 0 or 10−7 m GnRH or cetrorelix (Cet.) as indicated (only control cells are shown for HA-hGnRHR). These cells were then fixed, permeabilized, and stained before imaging as described in Materials and Methods. The images shown are from small proportions (∼10%) of representative fields, demonstrating the more punctate distribution of HA-hXGnRHR in GnRH-stimulated cells. This effect was quantified using imaging algorithms to determine the inclusion count (numbers of brightly stained puncta over and around the nucleus) as described in Materials and Methods. Panel B, Cells were transduced, loaded with anti-HA, and then incubated for 60 min at 37 C in medium with the 0 or 10−13 to 10−7 m GnRH or cetrorelix (Cet.) or with no addition (C, control) before image acquisition and analysis as above. The data show means ± sem (n = 3) from three separate experiments each with triplicate wells. HA-hGnRHR inclusion counts were too low for assessment of ligand effects (open triangles, HA-hGnRHR inclusion counts with 0 or 10−7 m GnRH), whereas inclusion counts for the HA-hXGnRHR were increased by GnRH and decreased by cetrorelix. *, P < 0.05; **, P < 0.01 compared with receptor-matched control. Panels C and D, Cells transduced with HA-h.XGnRHR or HA-A261K-h.XGnRHR were loaded with anti-HA and then washed and incubated 60 min at 37 C in medium with the no addition (ctrl.), with 10−7 m GnRH (GnRH or G), 10−7 cetrorelix (Cet. or C), 10−6 m IN3 (I) or with combinations of agonist and antagonist as indicated. They were then imaged and analyzed as above. The data shown are means ± sem (n = 3) from three separate experiments each with triplicate wells. **, P < 0.01 compared with receptor-matched control. Ctrl., Control.
Figure 6
Figure 6
Influence of GnRH on NFAT-EFP localization. A, HeLa cells were transduced with N-terminal HA-tagged hGnRHR (1 pfu/nl) and with Ad expressing the NFAT-EFP reporter and then cultured 18 h before stimulation for 45 min with 0 or 10−7 m GnRH. The cells were fixed, nuclei were stained (DAPI), and digital images were acquired as described in Materials and Methods. Representative images are shown for control and GnRH-stimulated wells (each <5% of the cells imaged in each field). The lower images illustrate segmentation and the application of a filter to define the proportion of cells in which the N:C NFAT-EFP ratio was less than 1.5 (0) or more than 1.5 (1). B, Cells were treated as above except that GnRH concentration was 10−12 to 10−6 m or 0 (C, control), and Ad HA-hGnRHR titer was 0 or 0.1–10 pfu/nl, as indicated. Each point shows the N:C NFAT-EFP ratio from three separate wells (mean ± sem) from a representative experiment.
Figure 7
Figure 7
Influence of IN3 and cetrorelix (Cet.) on GnRH-stimulated NFAT-EFP translocation. HeLa cells transduced with HA-tagged hGnRHR (1 pfu/nl) and the NFAT-EFP reporter were incubated 45 min with 10−11 to 10−6 m GnRH or without agonist (C, control) before imaging. Effects of IN3 (left panels) and cetrorelix (right panels) were also determined by coincubation of agonists and antagonists as indicated (panels A and B). GnRH dose-response curves were also generated in cells preincubated (18 h) with the indicated concentrations of IN3 or cetrorelix and then coincubated (45 min) with GnRH and the same antagonist concentration as used in the pretreatment (panels C and D). The effect of the preincubation is illustrated for a single antagonist concentration by comparison of curves with antagonist coincubation alone, and those with co- and preincubation with IN3 (10−7 m; panel E−data from panels A and C) or cetrorelix (10−8 m, panel F−data from panels B and D). The figures show the proportion of cells in which the N:C NFAT-EFP ratio was more than 1.5, normalized (as a percent of the internal control maximal response). Values shown are means ± sems (n = 3–4) from four separate experiments, each with triplicate wells. GnRH responses with antagonist coincubation differed significantly (P < 0.05) from those with antagonist co- and preincubation at 10−8 to 10−6 m GnRH (for both antagonists, panels E and F). +ve, Positive.
Figure 8
Figure 8
Effects of peptide and nonpeptide antagonists on GnRHR expression in gonadotrope lineage cells. Panels A–C, LβT2 cells transduced with Ad HA-hGnRHR, HA-h.XGnRHR, or HA-mGnRHR were incubated 18 h with 10−7 m IN3, cetrorelix (Cet.), or antide (Ant.) before cell-surface hGnRHR quantification as above. Panels D and E, Cells were treated as above except that they were transduced with Ad HA-hGnRHR and the 18-h incubation was with the indicated concentrations of IN3 or cetrorelix (panel D) or with varied concentrations of IN3 with or without 10−7 m cetrorelix (panel E). Data shown are the cell-surface GnRHR EI and are means ± sems (n = 3–8) pooled from repeated experiments after normalization to the maximal internal control value with IN3. ANOVA with post hoc Dunnett's tests revealed that the effects of all three antagonists were significant at all three receptors (panels A–D; *, P < 0.05; **, P < 0.01). Two-way ANOVA of the data in panel E revealed IN3 and cetrorelix as significant variables (P < 0.01), but the IN3-cetrorelix interaction term was not significant (P > 0.05). ctrl., Control.
Figure 9
Figure 9
Influence of IN3 and cetrorelix (Cet.) on GnRH-stimulated NFAT-EFP translocation in gonadotroph-lineage cells. LβT2 cells were transduced with the NFAT-EFP reporter (10 pfu/nl) and were stimulated 45 min with the indicated concentrations of GnRH as above (Fig. 7) except that they were not transduced with Ad GnRHR. Panel A shows representative images for control and 10−7 m GnRH-stimulated wells, and the lower images illustrate image segmentation and the application of a filter to define the proportion of cells in which the N:C NFAT-EFP ratio is more than 1.25. Effects of IN3 and cetrorelix were also determined by coincubation of the indicated doses of agonists and antagonists (panels B and C). GnRH concentration-response curves were also generated in cells preincubated (18 h) with the indicated concentrations of IN3 or cetrorelix and then coincubated (45 min) with the indicated concentration of GnRH and the same antagonist concentration as used in the pretreatment (panels D and E). The effect of the preincubation is illustrated for single antagonist concentrations by comparison of curves with antagonist coincubation alone and those with co- and preincubation with 10−8 m IN3 (panel F; data from panels B and D) or 10−9 m cetrorelix (panel G; data from panels C and E). The figures show the proportion of cells in which the N:C NFAT-EFP ratio was more than 1.25, normalized (as a percent of the internal control maximal response). Values shown are means ± sems (n = 3–4) from four separate experiments, each with triplicate wells.

Similar articles

Cited by

References

    1. Conn PM, Huckle WR, Andrews WV, McArdle CA 1987 The molecular mechanism of action of gonadotropin releasing hormone (GnRH) in the pituitary. Recent Prog Horm Res 43:29–68 - PubMed
    1. Stojilkovic SS, Catt KJ 1995 Expression and signal transduction pathways of gonadotropin-releasing hormone receptors. Recent Prog Horm Res 50:161–205 - PubMed
    1. Millar RP, Lu ZL, Pawson AJ, Flanagan CA, Morgan K, Maudsley SR 2004 Gonadotropin-releasing hormone receptors. Endocr Rev 25:235–275 - PubMed
    1. Cheng CK, Leung PC 2005 Molecular biology of gonadotropin-releasing hormone (GnRH)-I, GnRH-II, and their receptors in humans. Endocr Rev 26:283–306 - PubMed
    1. Rispoli LA, Nett TM 2005 Pituitary gonadotropin-releasing hormone receptor: structure, distribution and regulation of expression. Anim Reprod Sci 88:57–74 - PubMed

Publication types

MeSH terms