

Oxygen tension regulates pancreatic beta-cell differentiation through hypoxia-inducible factor 1alpha
- PMID: 20009089
- PMCID: PMC2828660
- DOI: 10.2337/db09-0891
Oxygen tension regulates pancreatic beta-cell differentiation through hypoxia-inducible factor 1alpha
Abstract
Objective: Recent evidence indicates that low oxygen tension (pO2) or hypoxia controls the differentiation of several cell types during development. Variations of pO2 are mediated through the hypoxia-inducible factor (HIF), a crucial mediator of the adaptative response of cells to hypoxia. The aim of this study was to investigate the role of pO2 in beta-cell differentiation.
Research design and methods: We analyzed the capacity of beta-cell differentiation in the rat embryonic pancreas using two in vitro assays. Pancreata were cultured either in collagen or on a filter at the air/liquid interface with various pO2. An inhibitor of the prolyl hydroxylases, dimethyloxaloylglycine (DMOG), was used to stabilize HIF1alpha protein in normoxia.
Results: When cultured in collagen, embryonic pancreatic cells were hypoxic and expressed HIF1alpha and rare beta-cells differentiated. In pancreata cultured on filter (normoxia), HIF1alpha expression decreased and numerous beta-cells developed. During pancreas development, HIF1alpha levels were elevated at early stages and decreased with time. To determine the effect of pO2 on beta-cell differentiation, pancreata were cultured in collagen at increasing concentrations of O2. Such conditions repressed HIF1alpha expression, fostered development of Ngn3-positive endocrine progenitors, and induced beta-cell differentiation by O2 in a dose-dependent manner. By contrast, forced expression of HIF1alpha in normoxia using DMOG repressed Ngn3 expression and blocked beta-cell development. Finally, hypoxia requires hairy and enhancer of split (HES)1 expression to repress beta-cell differentiation.
Conclusions: These data demonstrate that beta-cell differentiation is controlled by pO2 through HIF1alpha. Modifying pO2 should now be tested in protocols aiming to differentiate beta-cells from embryonic stem cells.
Figures
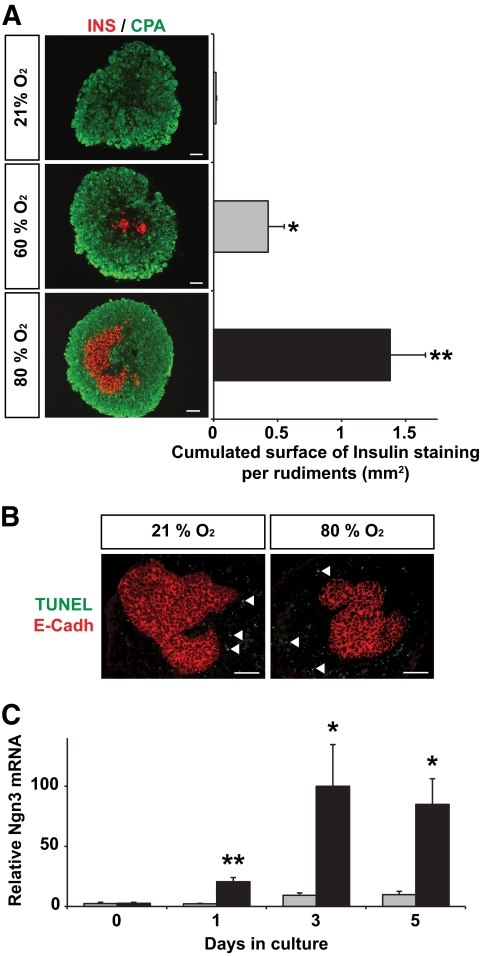
 ) or 80% (■) O2 at different time points. Gene expression is presented as a percentage of the highest sample. Each point represents the mean ± SEM of three individual data pools. *P < 0.05; **P < 0.01. (A high-quality digital representation of this figure is available in the online issue.)
 ) or 80% (■) O2. Gene expression is presented as a percentage of the highest sample. Each point represents the mean ± SEM of three individual pools. *P < 0.05; **P < 0.01. (A high-quality digital representation of this figure is available in the online issue.)
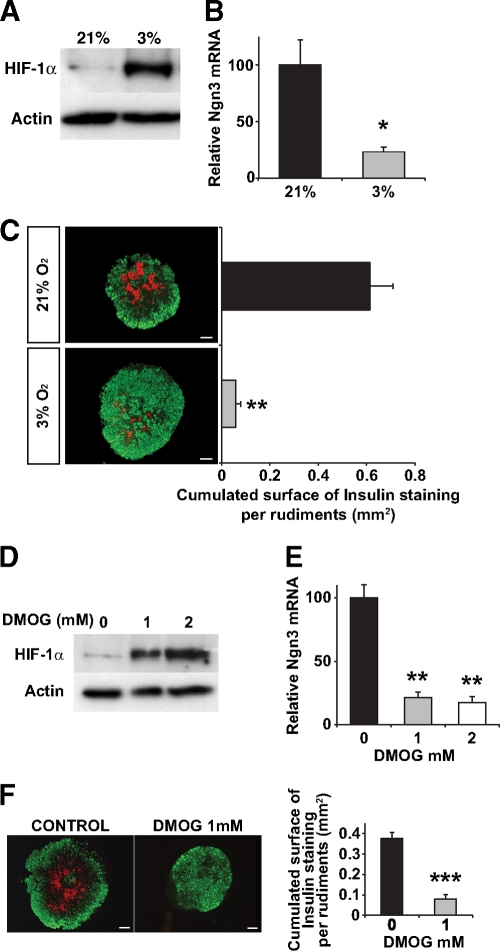 ) O2. Gene expression is presented as a percentage of the highest sample. Each point represents the mean ± SEM of three individual pools. *P < 0.05. C: Pancreata were cultured for 7 days at the air-medium interface at 21 or 3% O2. Immunohistochemistry was used to detect β- and acinar cells using antibodies directed against insulin (in red) and carboxypeptidase A (in green). Next, the absolute surface occupied by insulin-positive cells was quantified. Black and gray bars represent the surface of insulin-positive cells in pancreata cultured at 21 and 3% O2, respectively. **P < 0.01. D: Pancreata at E13.5 were cultured at the air-medium interface for 1 day in the presence or absence of 1 or 2 mmol/l DMOG, and HIF1α was analyzed by Western blot. E: Real-time PCR quantification of Ngn3 mRNA in pancreata cultured for 1 day with 0 (■), 1 (), or 2 (□) mmol/l DMOG at 21% O2. **P < 0.01. F: Pancreata cultured in the presence or absence of 1 mmol/l DMOG for 7 days were analyzed by immunohistochemistry. Acinar cells were detected using anti–carboxypeptidase A antibody (in green) and β-cells using anti-insulin antibody (in red). Next, the absolute surface occupied by insulin-positive cells was quantified. Gray and black bars represent the surface of insulin-positive cells in pancreata cultured at 21% O2 with or without DMOG, respectively. ***P < 0.001. (A high-quality digital representation of this figure is available in the online issue.)
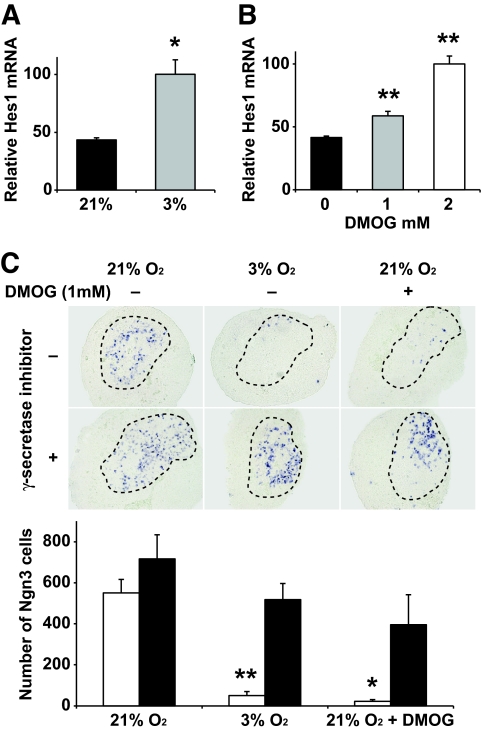 ) O2 for 1 day. *P < 0.05. B: Real-time PCR quantification of Hes1 mRNA in pancreata cultured at the air-medium interface with 0 (■), 1 (), or 2 (□) mmol/l DMOG for 1 day. **P < 0.01. C: Detection of Ngn3 transcripts by in situ hybridization in pancreata cultured for 1 day at 21% O2, 21%O2 with DMOG, or 3% O2 with or without γ-secretase inhibitor treatment. Epithelium is circled in black in each panel. The absolute number of Ngn3-positive cells was quantified in each condition in the presence (■) or absence (□) of γ-secretase inhibitor treatment. *P < 0.05; **P < 0.01. (A high-quality digital representation of this figure is available in the online issue.)
References
-
- Semenza GL: Life with oxygen. Science 2007; 318: 62– 64 - PubMed
-
- Semenza GL: Hypoxia-inducible factor 1: master regulator of O2 homeostasis. Curr Opin Genet Dev 1998; 8: 588– 594 - PubMed
-
- Ivan M, Kondo K, Yang H, Kim W, Valiando J, Ohh M, Salic A, Asara JM, Lane WS, Kaelin WG, Jr: HIFalpha targeted for VHL-mediated destruction by proline hydroxylation: implications for O2 sensing. Science 2001; 292: 464– 468 - PubMed
-
- Jaakkola P, Mole DR, Tian YM, Wilson MI, Gielbert J, Gaskell SJ, Kriegsheim A, Hebestreit HF, Mukherji M, Schofield CJ, Maxwell PH, Pugh CW, Ratcliffe PJ: Targeting of HIF-alpha to the von Hippel-Lindau ubiquitylation complex by O2-regulated prolyl hydroxylation. Science 2001; 292: 468– 472 - PubMed
-
- Holmquist-Mengelbier L, Fredlund E, Lofstedt T, Noguera R, Navarro S, Nilsson H, Pietras A, Vallon-Christersson J, Borg A, Gradin K, Poellinger L, Pahlman S: Recruitment of HIF-1alpha and HIF-2alpha to common target genes is differentially regulated in neuroblastoma: HIF-2alpha promotes an aggressive phenotype. Cancer Cell 2006; 10: 413– 423 - PubMed
Publication types
MeSH terms
Substances
Grants and funding
LinkOut - more resources
Full Text Sources
Other Literature Sources
