. 2009 Dec 15;2(101):ra82.
doi: 10.1126/scisignal.2000446.

EGFR signaling through an Akt-SREBP-1-dependent, rapamycin-resistant pathway sensitizes glioblastomas to antilipogenic therapy

Affiliations

EGFR signaling through an Akt-SREBP-1-dependent, rapamycin-resistant pathway sensitizes glioblastomas to antilipogenic therapy

Deliang Guo et al. Sci Signal. .

Abstract

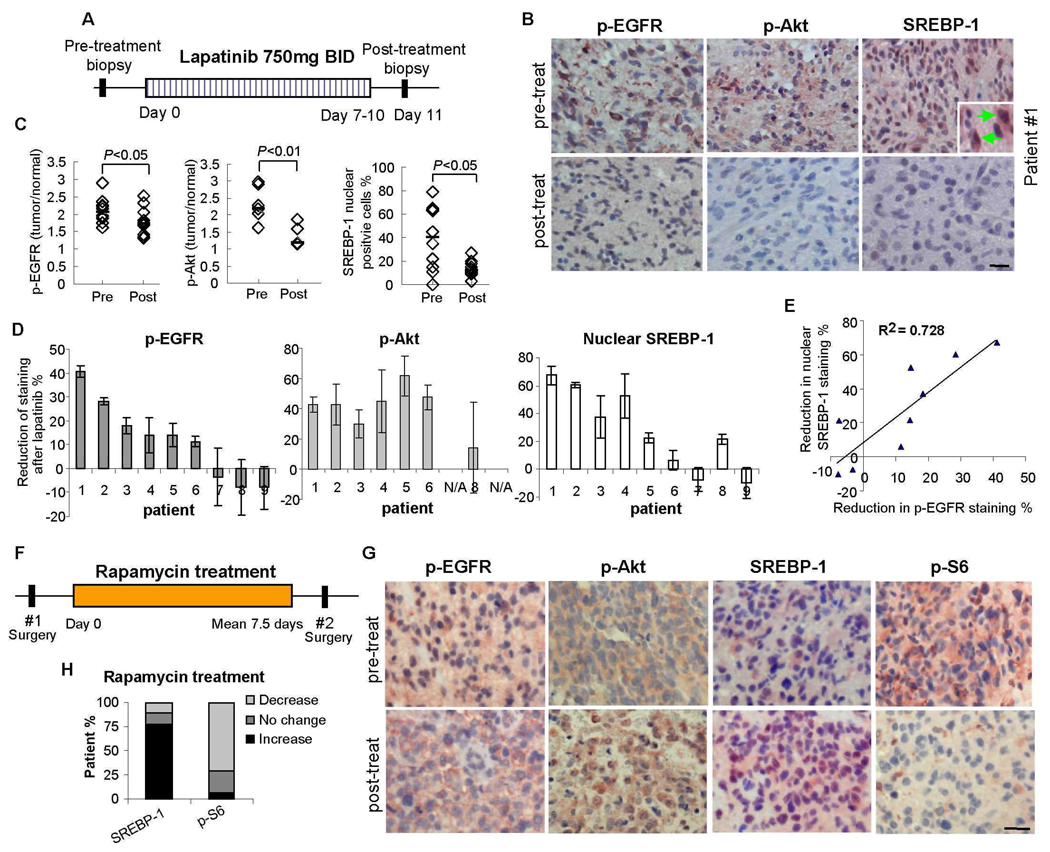
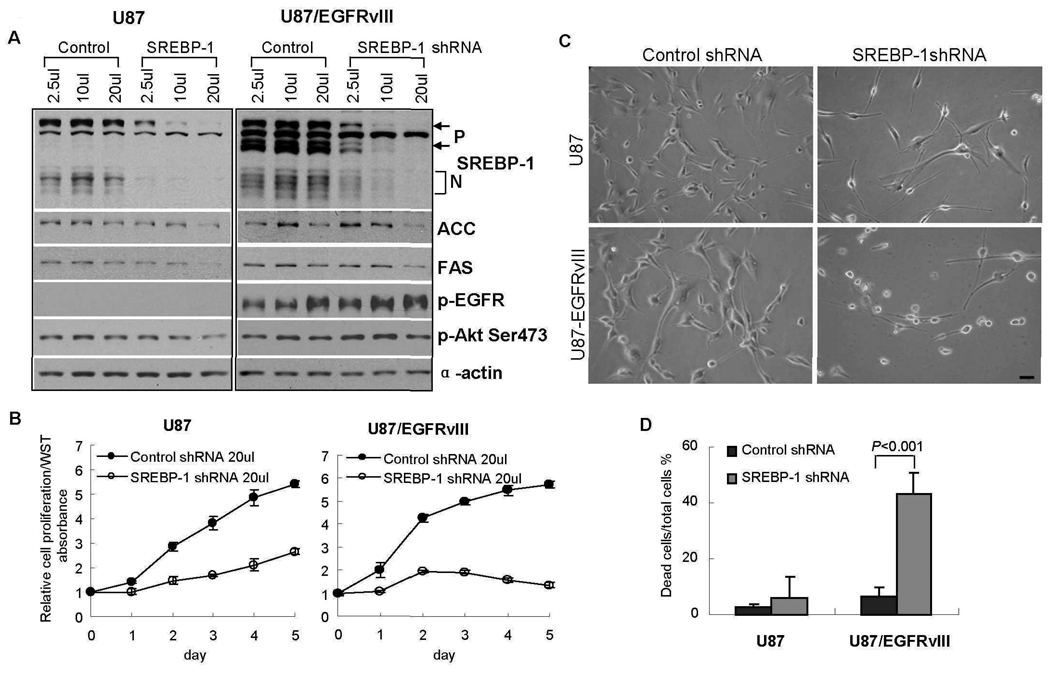
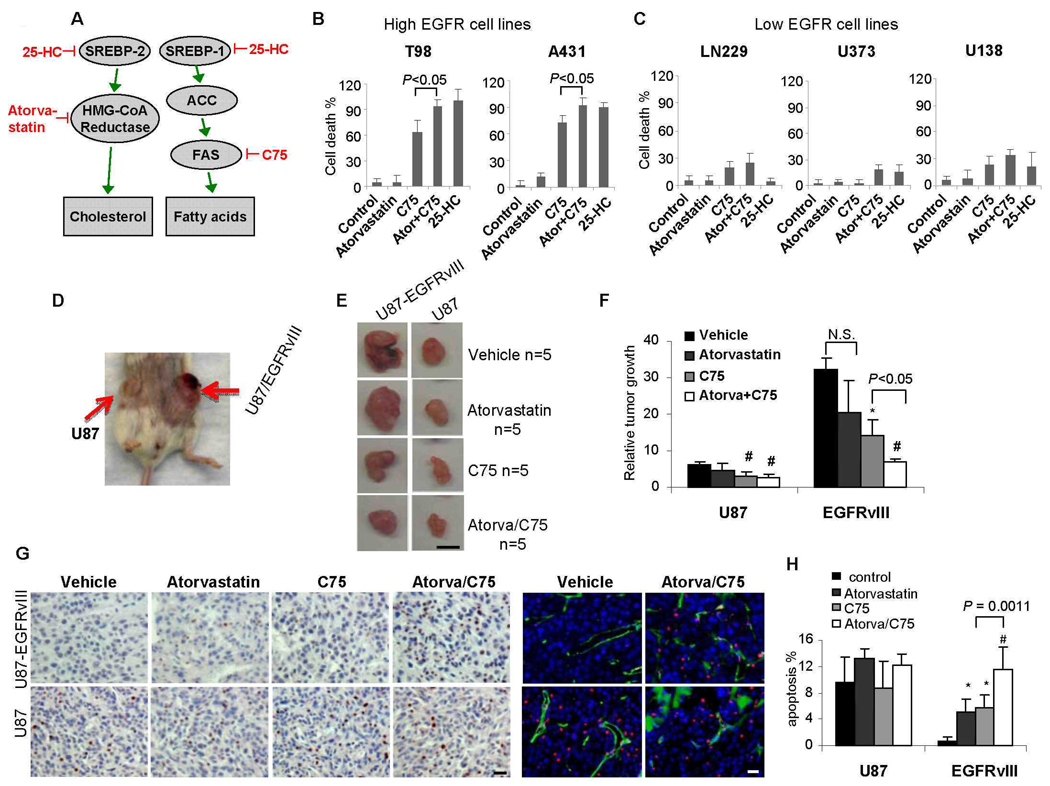
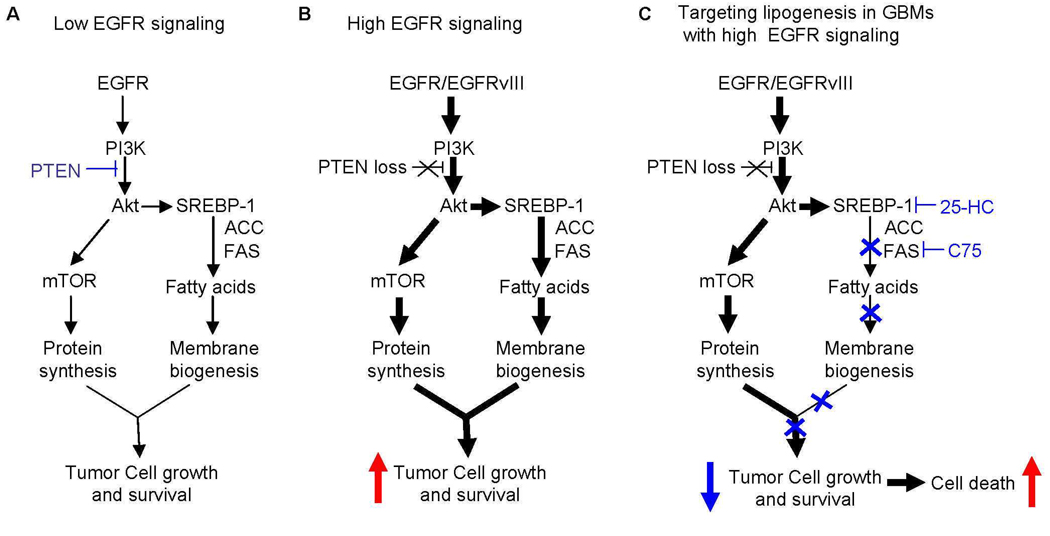
Glioblastoma, the most common malignant brain tumor, is among the most lethal and difficult cancers to treat. Although epidermal growth factor receptor (EGFR) mutations are frequent in glioblastoma, their clinical relevance is poorly understood. Studies of tumors from patients treated with the EGFR inhibitor lapatinib revealed that EGFR induces the cleavage and nuclear translocation of the master transcriptional regulator of fatty acid synthesis, sterol regulatory element-binding protein 1 (SREBP-1). This response was mediated by Akt; however, clinical data from rapamycin-treated patients showed that SREBP-1 activation was independent of the mammalian target of rapamycin complex 1, possibly explaining rapamycin's poor efficacy in the treatment of such tumors. Glioblastomas without constitutively active EGFR signaling were resistant to inhibition of fatty acid synthesis, whereas introduction of a constitutively active mutant form of EGFR, EGFRvIII, sensitized tumor xenografts in mice to cell death, which was augmented by the hydroxymethylglutaryl coenzyme A reductase inhibitor atorvastatin. These results identify a previously undescribed EGFR-mediated prosurvival metabolic pathway and suggest new therapeutic approaches to treating EGFR-activated glioblastomas.


Figures

Fig. 1
Fig. 1
EGFR and Akt signaling and nuclear SREBP-1 accumulation response data in the first set of 9 GBM patients receiving lapatinib in a Phase II clinical trial. (A) Tumor tissue was analyzed from 9 GBM patients before and after treatment with the EGFR inhibitor lapatinib. (B) Immunohistochemical staining (reddish brown) of phospho-EGFR Tyr1086, phospho-Akt Ser473 and SREBP-1 before and after treatment with lapatinib from a representative patient (#1). Nuclei were counterstained with hematoxylin (blue). Inset shows nuclear SREBP-1 staining indicated by green arrow. Scale bar = 20 um. (C) Quantification of immunohistochemical staining from >1000 cells from at least five representative areas of each tumor before and after lapatinib treatment, P-values were determined by Wilcoxon text (7). Each diamond represents an individual patient. (D) Reduction of p-EGFR, p-Akt and nuclear SREBP-1 staining for each GBM patient before (S1) and after (S2) treatment with lapatinib. (E) Correlation between inhibition of p-EGFR and inhibition of nuclear SREBP-1 staining. (F) Analysis of tumor tissue from 9 GBM patients before and after treatment with rapamycin. (G) Immunohistochemical staining (reddish brown) of p-EGFR Tyr1086, p-Akt Ser473, SREBP-1 and p-S6 Ser235/236 before and after treatment with rapamycin. (H) Percentage of patients with decreased nuclear SREBP-1 staining and percentage of patients with decreased p-S6 staining. Scale bar = 20 um.
Fig. 2
Fig. 2
Increased SREBP-1 cleavage and fatty acid accumulation in GBM cell lines correlates with abundant EGFR-PI3K-Akt signaling. (A) Western blot analysis of lysates from cell lines cultured in medium containing 1% FBS. For SREBP-1 immunoblot, P=Precursor; N=cleaved NH2 terminal form. α-actin used as loading control. (B) Biochemical analysis of effect of transfection of EGFRvIII or wild-type EGFR on SREBP-1 cleavage compared with parental U87 GBM cells that endogenously contain little EGFR and no EGFRvIII. Cell lines were cultured in serum-free media for 48 hrs. (C) Total lipid extracts from U87 GBM cells, with or without EGFRvIII or EGFR over-expression, cultured in serum-free media for 48 hours were subjected to thin layer chromatography and visualized by iodine.
Fig. 3
Fig. 3
Pharmacologic and genetic manipulation of GBM cells demonstrates that EGFR-PI3K-Akt signaling promotes SREBP-1 cleavage and binding to the FAS promoter (A) Effect of EGF dose, and time course of EGF effect on SREBP-1 cleavage (B). U87-EGFR GBM cells were cultured in serum-free medium for 24 hrs and treated for 6 hrs with indicated concentration of EGF or with EGF (20 ng/ml) in time course experiments. Immunoblot analysis was performed with indicated antibodies. Antibodies against total proteins recognize both phosphorylated and nonphosphorylated proteins. (C) A schematic depicting the human FAS locus and approximate locations of the qPCR amplicons. TSS represents transcription start site. Up represents a site 200 base pairs upstream. (D) SREBP-1 abundance at the FAS transcription start site increases in response to EGF treatment. Chromatin immunoprecipitation was performed on U87-EGFR cells with EGF (20 ng/mL) for 4 hrs. Data are normalized against a fraction of the input gDNA, and each bar represents the mean +/− SEM of three independent biologic replicates. * P= 0.02 relative to non-EGF treated samples. (E) Effect of the EGFR inhibitor erlotinib (10 uM), the PI3K inhibitor LY294002 (20 uM), Akt inhibitor Akti-1/2 (5 uM) or rapamycin (1 nM) for 16 hours on SREBP-1 cleavage in U87-EGFR cells. (F) Effect of PTEN reconstitution on EGFRvIII-mediated SREBP-1 cleavage, and ACC and FAS abundance.
Fig. 4
Fig. 4
p-EGFR is associated with p-Akt, nuclear SREBP-1 and increased abundance of ACC and FAS in a cohort of 140 GBM patients. (A) Analysis of p-EGFR, p-Akt, nuclear SREBP-1, and FAS and ACC abundance (reddish brown) in two tissue microarrays comprising 252 tumor cores and 91 matched normal cores from 140 primary (de novo) GBM patients. Inset demonstrates nuclear SREBP-1 staining. Images are 20×, tissue is counterstained with hematoxylin. Scale bar = 20 um. (B) Multidimensional scaling plot based on correlations between EGFR, p-EGFR Tyr1086, p-Akt Ser473, nuclear SREBP-1, ACC and FAS. (C) Representative gross and microscopic pictures of tumor tissue (T) and contralateral normal brain tissue (N) from the brain of a GBM patient obtained at autopsy. Scale bar = 20 um. (D) Immunoblot analysis of p-EGFR, p-Akt, SREBP-1 cleavage, and ACC and FAS abundance in tumor (T) and contralateral normal brain tissue (N) from for three GBM patients obtained at autopsy.
Fig. 5
Fig. 5
ShRNA knock down of SREBP-1 promotes extensive tumor cell death of EGFRvIII-bearing GBM cells. (A) Immunoblot analysis demonstrating shRNA knockdown of SREBP-1 in U87 and U87-EGFRvIII GBM cells. SREBP-1 abundance was substantially reduced 48 hours after shRNA lentiviral infection. Cell lysates were analyzed by Western blot using the indicated antibodies. (B) Cells were infected with SREBP-1 shRNA lentivirus or scrambled control shRNA lentivirus for 24 hrs, subcultured into 96 well plates, and changed to 1% FBS medium after 24 hrs. Relative cell proliferation was assayed daily until day 5 using the WST assay (Chemicon). (C, D) Cells were infected with SREBP-1 shRNA lentivirus or scrambled control for 24 hrs, split into 12 well plates and change to 1% FBS medium for 4 days after 24 hrs. Cell morphology was imaged using a phase contrast invert-microscope and digital camera and cell death was measured by trypan blue exclusion. Scale bar = 20 um.
Fig. 6
Fig. 6
A constitutively active form of the EGFR allele is sufficient to sensitize GBMs in vitro and in vivo to apoptotic cell death in response to fatty acid synthase inhibition. (A) Schematic view of inhibitors. (B) Effect of the FAS inhibitor C75 (10 µg/ml) and the HMG-CoA reductase inhibitor atorvastatin (1 µM), alone or in combination in EGFR-high GBM cell lines relative to (C) EGFR-low cell lines. Cell death was measured by trypan blue exclusion. (D) In vivo model in which U87 cells, or U87 cells transfected with EGFRvIII were subcutaneously implanted in the flank of immunocompromised mice. EGFRvIII-bearing tumors are significantly larger. (E) Effect of C75 (30 mg/kg weekly) or atorvastatin (10 mg/kg daily) alone or in combination. Scale bar = 1mm. (F) Quantification of the effect on tumor size. # P<0.05 compared with vehicle treated tumor volume; * P<0.05 compared with vehicle treated tumor volume; N.S. means no significant. (G) Representative images demonstrating TUNEL staining to assess apoptotic effect. Scale bar = 20 um. (H) Quantification of TUNEL staining. * P<0.01 compared with vehicle treated tumor; # P<0.0001 compared with vehicle treated tumor.
Fig. 7
Fig. 7
Model demonstrating the specific apoptotic effect of SREBP-1 and FAS inhibition on GBM cells bearing EGFRvIII. (A) In cells with little EGFR and intact PTEN, the demand for lipogenesis is modest and is balanced by low levels of SREBP-1 pathway activation. (B) In GBM cells with abundant EGFR and PTEN loss, the SREBP-1-ACC-FAS pathway is upregulated to meet the demand for increased fatty acid synthesis for membrane biogenesis of rapidly dividing cancer cells. (C) The SREBP-1 pathway becomes essential for survival in GBM cells bearing EGFRvIII. Targeting SREBP-1 or FAS is therefore lethal to EGFRvIII-bearing GBM cells.

Similar articles

Cited by

References

    1. Stupp R, Mason WP, van den Bent MJ, Weller M, Fisher B, Taphoorn MJ, Belanger K, Brandes AA, Marosi C, Bogdahn U, Curschmann J, Janzer RC, Ludwin SK, Gorlia T, Allgeier A, Lacombe D, Cairncross JG, Eisenhauer E, Mirimanoff RO. Radiotherapy plus concomitant and adjuvant temozolomide for glioblastoma. N Engl J Med. 2005;352:987–996. - PubMed
    1. Furnari FB, Fenton T, Bachoo RM, Mukasa A, Stommel JM, Stegh A, Hahn WC, Ligon KL, Louis DN, Brennan C, Chin L, DePinho RA, Cavenee WK. Malignant astrocytic glioma: genetics, biology, and paths to treatment. Genes Dev. 2007;21:2683–2710. - PubMed
    1. Comprehensive genomic characterization defines human glioblastoma genes and core pathways. Nature. 2008;455:1061–1068. - PMC - PubMed
    1. Bublil EM, Yarden Y. The EGF receptor family: spearheading a merger of signaling and therapeutics. Curr Opin Cell Biol. 2007;19:124–134. - PubMed
    1. Schlessinger J. Cell signaling by receptor tyrosine kinases. Cell. 2000;103:211–225. - PubMed

Publication types

MeSH terms