

Induction of E-cadherin in lung cancer and interaction with growth suppression by histone deacetylase inhibition
- PMID: 20009910
- PMCID: PMC2796578
- DOI: 10.1097/JTO.0b013e3181bc9419
Induction of E-cadherin in lung cancer and interaction with growth suppression by histone deacetylase inhibition
Abstract
Introduction: Loss of E-cadherin confers a poor prognosis in lung cancer patients and is associated with in vitro resistance to endothelial growth factor receptor inhibitors. Zinc finger E box-binding homeobox (ZEB)-1, the predominant transcriptional suppressor of E-cadherin in lung tumor lines, recruits histone deacetylases (HDACs) as co-repressors.
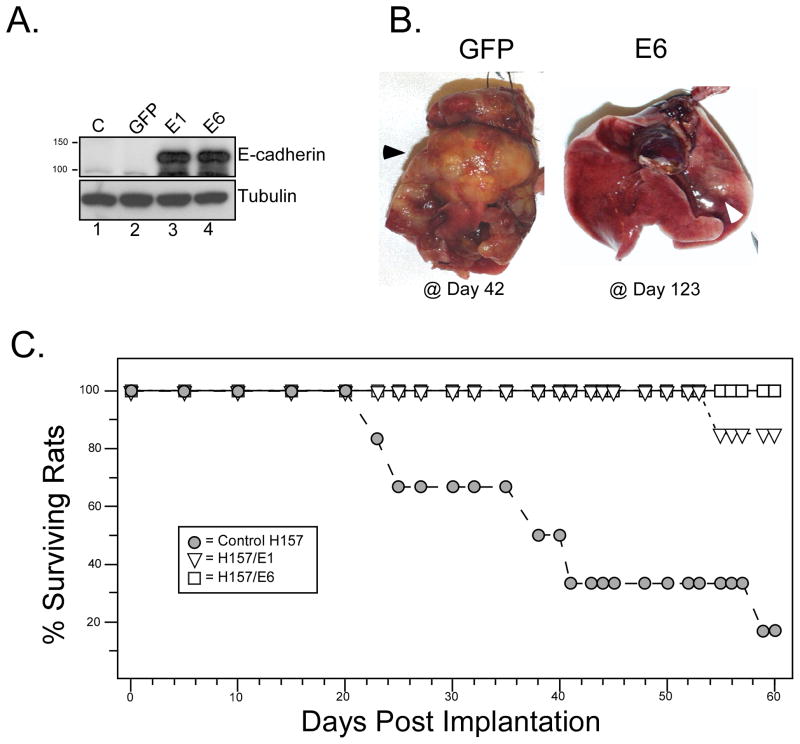
Methods: NSCLC cell lines were treated with HDAC inhibitors and analyzed for E-cadherin induction, growth inhibition and apoptosis. National Cancer Institute-H157 cells expressing ectopic E-cadherin were tested for tumorigenicity in murine xenografts.
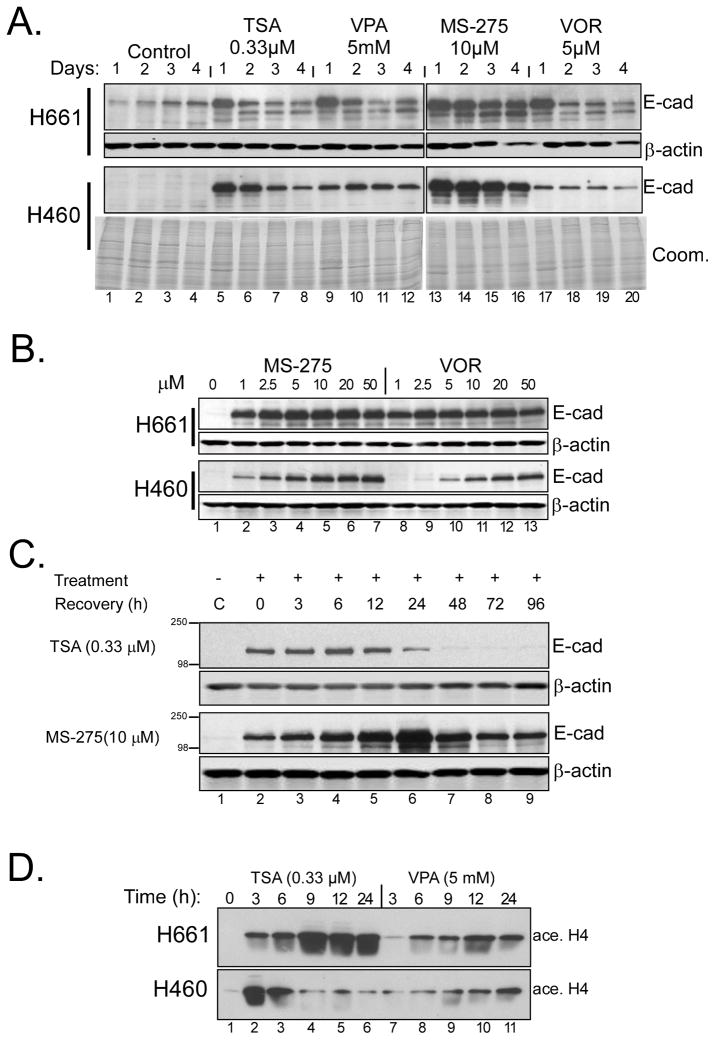
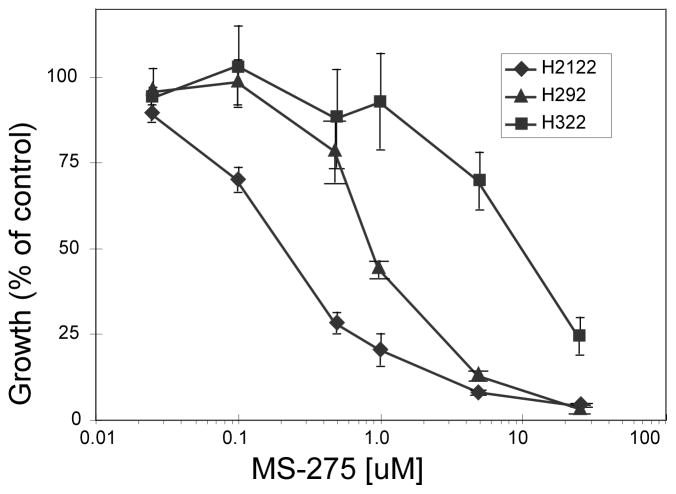
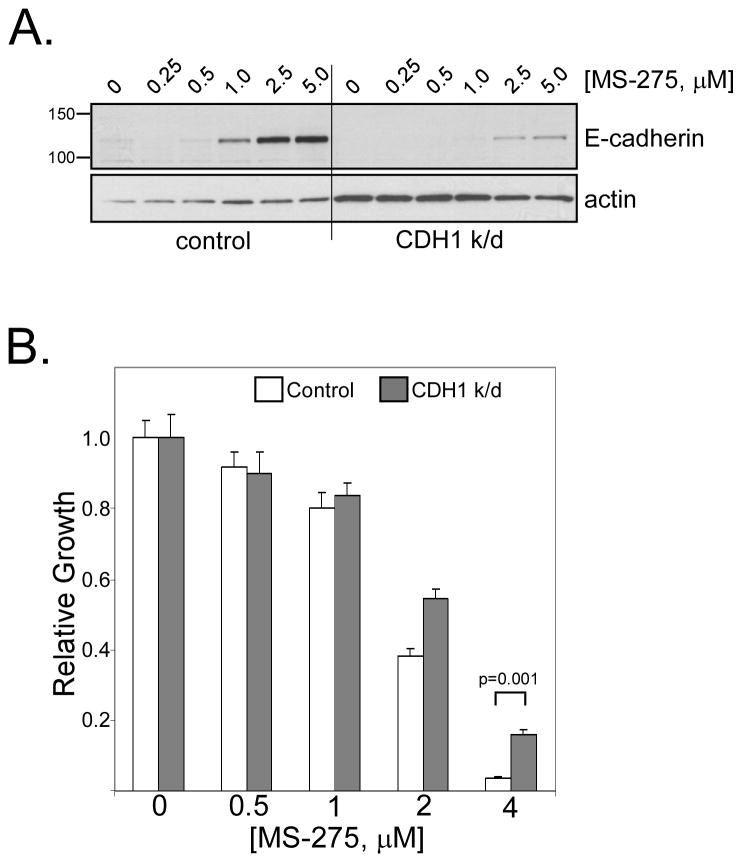
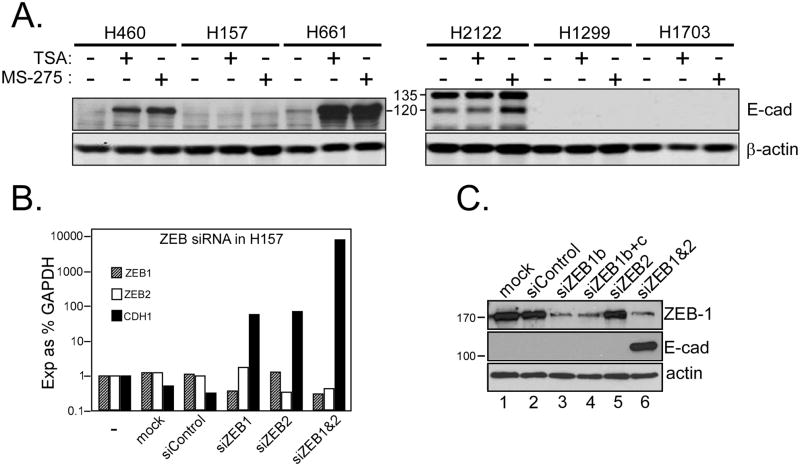
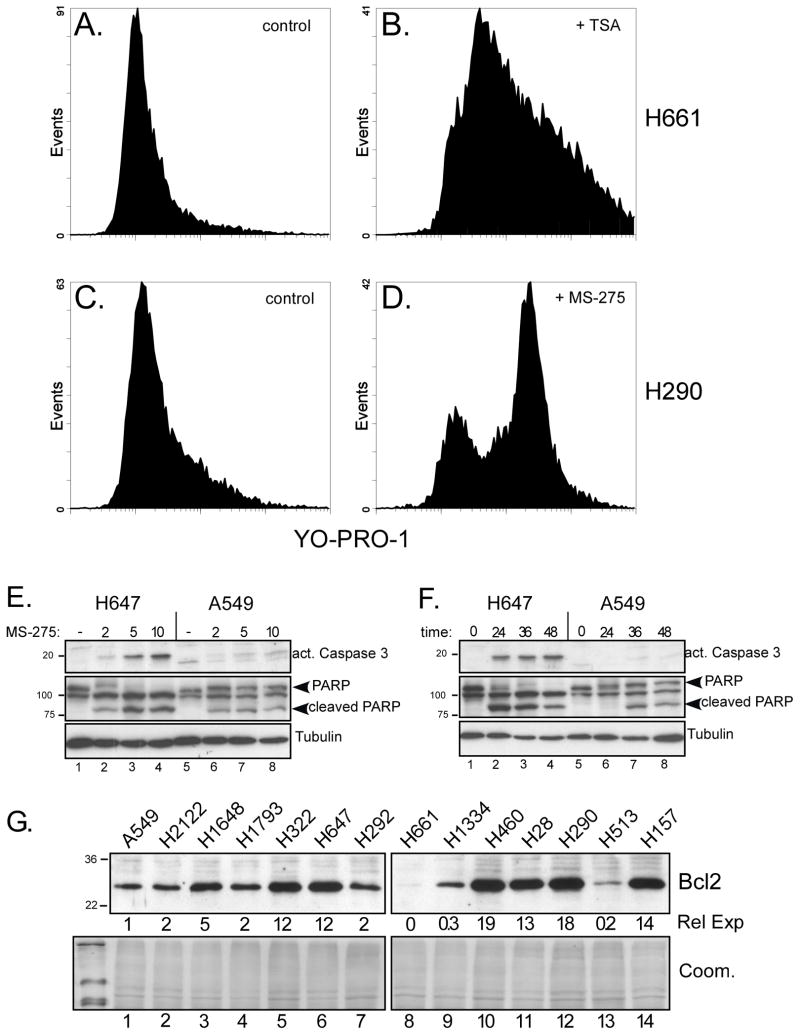
Results: We found that treatment with MS-275, compared to vorinostat (SAHA), valproic acid or trichostatin A, was most effective in E-cadherin up-regulation and persistence in non-small cell lung cancers. As with other tumor types and HDAC inhibitors, MS-275 inhibited growth and induced apoptosis. Importantly, blocking E-cadherin induction by short hairpin RNA resulted in less inhibition by MS-275, implicating the epithelial to mesenchymal phenotype process as a contributing factor. In contrast to H460 and H661, H157 cells were resistant to E-cadherin up-regulation by HDAC inhibitors. However, E-cadherin was restored, in a synergistic manner, by combined knockdown of ZEB-1 and ZEB-2. In addition, H157 cells stably transfected with E-cadherin were markedly attenuated in their tumor forming ability. Lastly, combining MS-275 with the microtubule stabilizing agent, paclitaxel, or 17-(allylamino)-17-demethoxygeldanamycin, a heat shock protein 90 inhibitor, resulted in synergistic growth inhibition. Since MS-275 has no reported activity against HDAC6, which regulates both microtubule and heat shock protein 90 functions, other mechanisms of synergy are anticipated.
Conclusions: These results support the role of ZEB proteins and HDAC inhibitors in the pathogenesis and treatment of lung cancer.
Figures
Similar articles
-
Simultaneous NF-κB inhibition and E-cadherin upregulation mediate mutually synergistic anticancer activity of celastrol and SAHA in vitro and in vivo.Int J Cancer. 2014 Oct 1;135(7):1721-32. doi: 10.1002/ijc.28810. Epub 2014 Mar 7. Int J Cancer. 2014. PMID: 24615207
-
Silibinin synergizes with histone deacetylase and DNA methyltransferase inhibitors in upregulating E-cadherin expression together with inhibition of migration and invasion of human non-small cell lung cancer cells.J Pharmacol Exp Ther. 2013 May;345(2):206-14. doi: 10.1124/jpet.113.203471. Epub 2013 Mar 5. J Pharmacol Exp Ther. 2013. PMID: 23461975 Free PMC article.
-
Suppression of triple-negative breast cancer metastasis by pan-DAC inhibitor panobinostat via inhibition of ZEB family of EMT master regulators.Breast Cancer Res Treat. 2014 Jun;145(3):593-604. doi: 10.1007/s10549-014-2979-6. Epub 2014 May 9. Breast Cancer Res Treat. 2014. PMID: 24810497 Free PMC article.
-
A promising future for breast cancer therapy with hydroxamic acid-based histone deacetylase inhibitors.Bioorg Chem. 2025 Mar;156:108169. doi: 10.1016/j.bioorg.2025.108169. Epub 2025 Jan 20. Bioorg Chem. 2025. PMID: 39862739 Review.
-
Isoform-selective histone deacetylase inhibitors.Chem Soc Rev. 2008 Jul;37(7):1402-13. doi: 10.1039/b703830p. Epub 2008 May 8. Chem Soc Rev. 2008. PMID: 18568166 Free PMC article. Review.
Cited by
-
Histone Deacetylases as New Therapeutic Targets in Triple-negative Breast Cancer: Progress and Promises.Cancer Genomics Proteomics. 2017 Sep-Oct;14(5):299-313. doi: 10.21873/cgp.20041. Cancer Genomics Proteomics. 2017. PMID: 28870998 Free PMC article. Review.
-
Epigenetic Regulation of the Epithelial to Mesenchymal Transition in Lung Cancer.Cancers (Basel). 2017 Jun 24;9(7):72. doi: 10.3390/cancers9070072. Cancers (Basel). 2017. PMID: 28672805 Free PMC article. Review.
-
Histone deacetylase inhibitor induces the expression of select epithelial genes in mouse utricle sensory epithelia-derived progenitor cells.Cell Reprogram. 2014 Aug;16(4):266-75. doi: 10.1089/cell.2013.0086. Epub 2014 Jun 19. Cell Reprogram. 2014. PMID: 24945595 Free PMC article.
-
Epigenomics in cancer management.Cancer Manag Res. 2010 Oct 27;2:255-65. doi: 10.2147/CMR.S7280. Cancer Manag Res. 2010. PMID: 21188117 Free PMC article.
-
Histone deacetylase inhibitor induces cell apoptosis and cycle arrest in lung cancer cells via mitochondrial injury and p53 up-acetylation.Cell Biol Toxicol. 2016 Dec;32(6):469-482. doi: 10.1007/s10565-016-9347-8. Epub 2016 Jul 16. Cell Biol Toxicol. 2016. PMID: 27423454 Free PMC article.
References
-
- Jemal A, Siegel R, Ward E, et al. Cancer statistics. CA Cancer J Clin. 2006;56(2):106–30. - PubMed
-
- Parkin DM, Bray F, Ferlay J, Pisani P. Global cancer statistics, 2002. CA Cancer J Clin. 2005;55(2):74–108. - PubMed
-
- Henschke CI, Yankelevitz DF, Libby DM, Pasmantier MW, Smith JP, Miettinen OS. Survival of patients with stage I lung cancer detected on CT screening. The New England journal of medicine. 2006;355(17):1763–71. - PubMed
-
- Welch HG, Woloshin S, Schwartz LM, et al. Overstating the evidence for lung cancer screening: the International Early Lung Cancer Action Program (I-ELCAP) study. Archives of internal medicine. 2007;167(21):2289–95. - PubMed
-
- Sone S, Nakayama T, Honda T, et al. CT findings of early-stage small cell lung cancer in a low-dose CT screening programme. Lung cancer (Amsterdam, Netherlands) 2007;56(2):207–15. - PubMed
Publication types
MeSH terms
Substances
Grants and funding
LinkOut - more resources
Full Text Sources
Other Literature Sources
Medical
Research Materials
