

Dynamics of interstitial and intracellular pH in evolving brain infarct
- PMID: 2001008
- PMCID: PMC3062631
- DOI: 10.1152/ajpregu.1991.260.3.R581
Dynamics of interstitial and intracellular pH in evolving brain infarct
Abstract
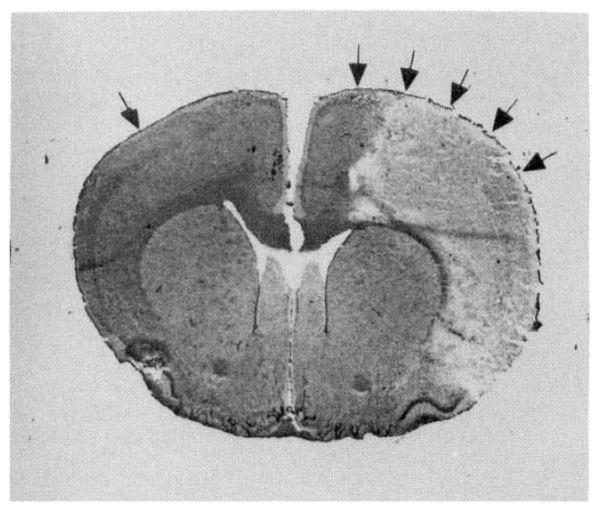
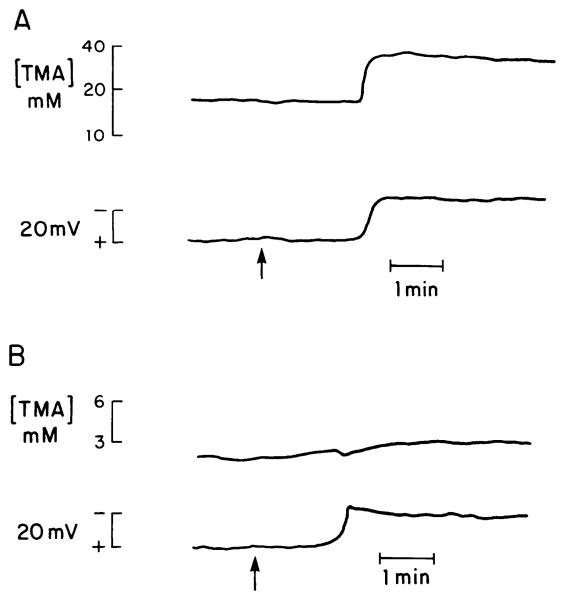
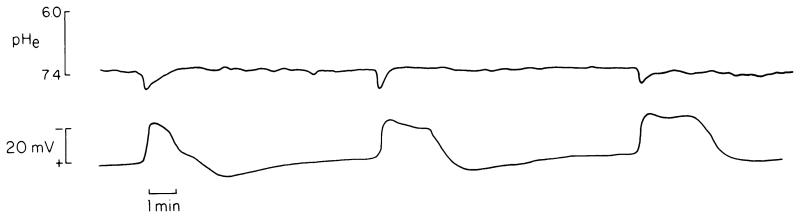
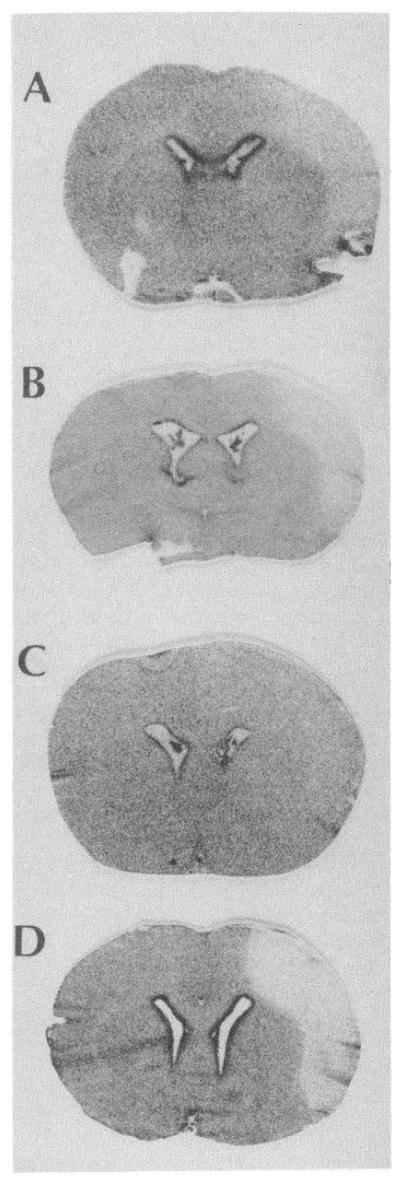
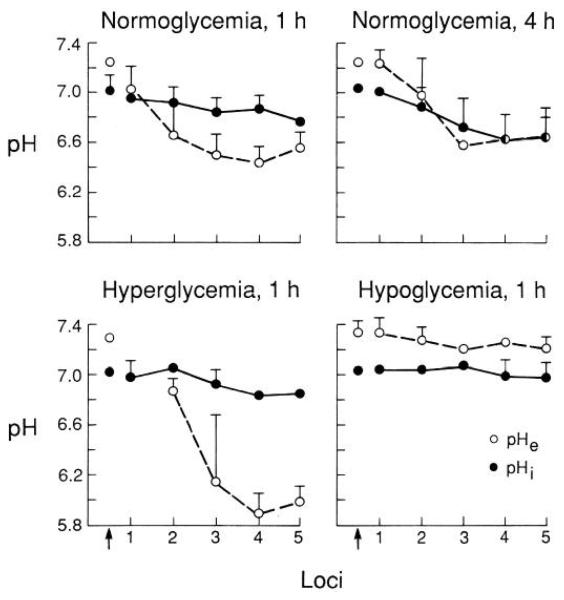
We examined the relationships between intracellular pH (pHi) and interstitial pH (pHe) in a rat model of focal ischemia. Interstitial pH was measured with pH-sensitive microelectrodes, and the average tissue pH was measured with the [14C]dimethadione method in rats subjected to occlusion of the right middle cerebral and common carotid arteries (MCA-CCAO). In normal cortex, pHe and pHi were 7.24 +/- 0.97 and 7.01 +/- 0.13 (means +/- SD, n = 6), respectively. In the ischemic cortex, pHe fell to 6.43 +/- 0.13, whereas pHi decreased only to 6.86 +/- 0.11 (n = 5) 1 h after MCA-CCAO. After 4 h of ischemia, the pHe was 6.61 +/- 0.09 and pHi was 6.62 +/- 0.20 (n = 4). Treatment with glucose before ischemia markedly lowered the pHe (5.88 +/- 0.17) but not pHi (6.83 +/- 0.03, n = 4) measured 1 h after ischemia. In the ischemic cortex of animals made hypoglycemic by pretreatment with insulin, neither pHe (7.25 +/- 0.06) nor pHi (6.99 +/- 0.13, n = 4) decreased. The demonstrated difference in pHi and pHe indicates that some cells remained sufficiently functional to maintain a plasma membrane gradient of protons within the evolving infarct. If the calculated pHi values accurately reflect the true pHi of cells within zones of severe focal ischemia, then cerebral infarction can proceed at pHi levels not greatly altered from normal.
Figures
References
-
- Amman D, Lanter F, Steiner RA, Schulthero P, Shijo Y, Simon W. Neutral carrier based hydrogen in a selective microelectrode for extra and intracellular studies. Anal. Chem. 1981;53:2267–2269. - PubMed
-
- Arnold JB, Junck L, Rottenberg DA. In vivo measurement of regional brain and tumor pH using [14C]dimethyloxazolidinedione and quantitative autoradiography. J. Cereb. Blood Flow Metab. 1985;5:369–375. - PubMed
-
- Brint S, Jacewicz M, Kiessling M, Tanabe J, Pulsinelli W. Focal brain ischemia in the rat: methods for reproducible neocortical infarction using tandem occlusion of the distal middle cerebral and ipsilateral common carotid arteries. J. Cereb. Blood Flow Metab. 1988;8:474–485. - PubMed
-
- Boron WF, Roos A. Comparison of microelectrode, DMO and methylamine methods for measuring intracellular pH. Am. J. Physiol. 1976;231:799–809. - PubMed
-
- Busa WB, Nuccitelli R. Metabolic regulation via intracellular pH. Am. J. Physiol. 1984;246:R409–R438. (Regulatory Integrative Comp. Physiol. 15) - PubMed
Publication types
MeSH terms
Substances
Grants and funding
LinkOut - more resources
Full Text Sources
Other Literature Sources