

Cycle training increased GLUT4 and activation of mammalian target of rapamycin in fast twitch muscle fibers
- PMID: 20010125
- PMCID: PMC2796589
- DOI: 10.1249/MSS.0b013e3181ad7f36
Cycle training increased GLUT4 and activation of mammalian target of rapamycin in fast twitch muscle fibers
Abstract
Purpose: To determine whether cycle training of sedentary subjects would increase the expression of the principle muscle glucose transporters, six volunteers completed 6 wk of progressively increasing intensity stationary cycle cycling.
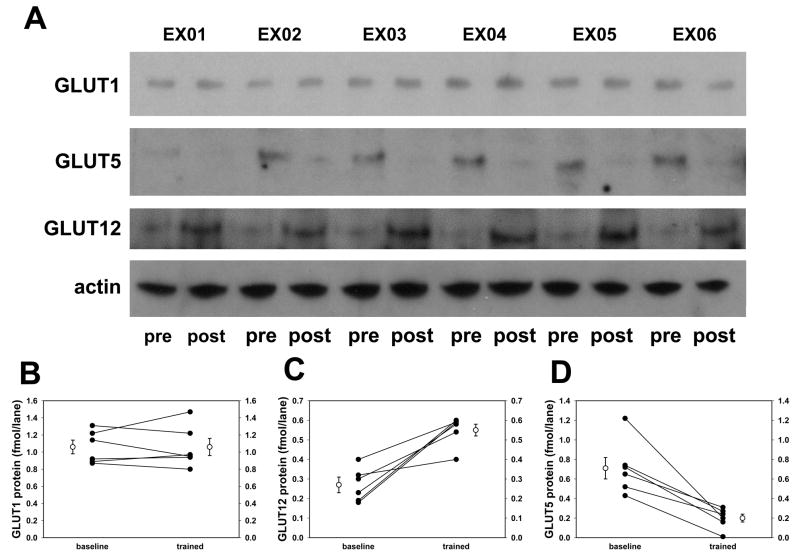
Methods: In vastus lateralis muscle biopsies, changes in expression of GLUT1, GLUT4, GLUT5, and GLUT12 were compared using quantitative immunoblots with specific protein standards. Regulatory pathway components were evaluated by immunoblots of muscle homogenates and immunohistochemistry of microscopic sections.
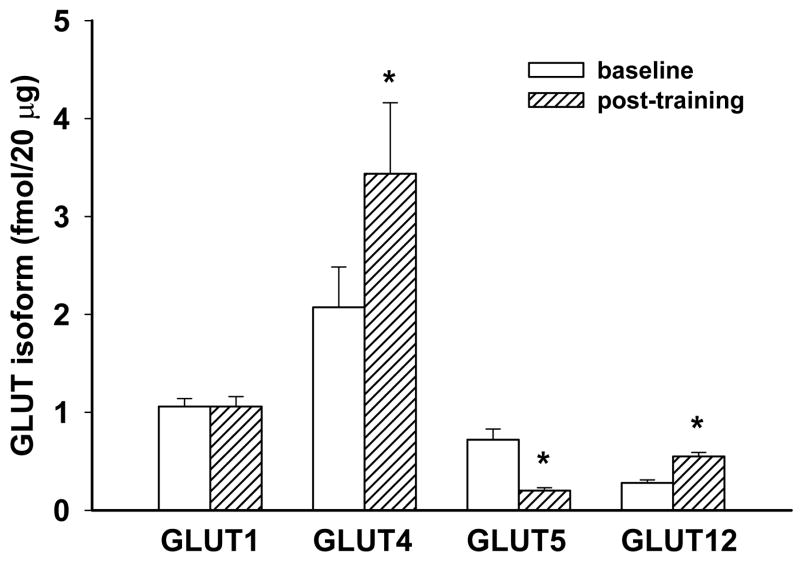
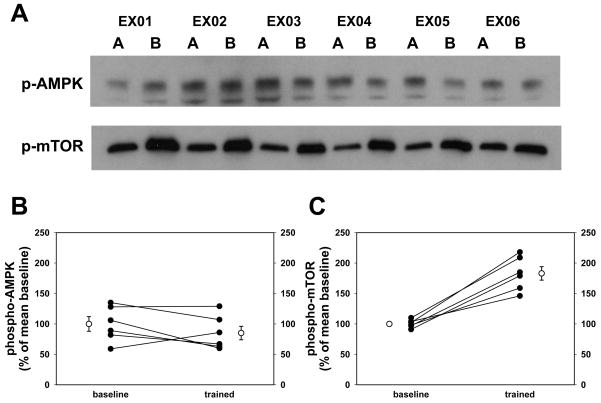
Results: GLUT1 was unchanged, GLUT4 increased 66%, GLUT12 increased 104%, and GLUT5 decreased 72%. A mitochondrial marker (cytochrome c) and regulators of mitochondrial biogenesis (peroxisome proliferator-activated receptor gamma coactivator 1 alpha and phospho-5'-adenosine monophosphate-activated protein kinase) were unchanged, but the muscle hypertrophy pathway component, phospho-mammalian target of rapamycin (mTOR), increased 83% after the exercise program. In baseline biopsies, GLUT4 by immunohistochemical techniques was 37% greater in Type I (slow twitch, red) muscle fibers, but the exercise training increased GLUT4 expression in Type II (fast twitch, white) fibers by 50%, achieving parity with the Type I fibers. Baseline phospho-mTOR expression was 50% higher in Type II fibers and increased more in Type II fibers (62%) with training but also increased in Type I fibers (34%).
Conclusion: Progressive intensity stationary cycle training of previously sedentary subjects increased muscle insulin-responsive glucose transporters (GLUT4 and GLUT12) and decreased the fructose transporter (GLUT5). The increase in GLUT4 occurred primarily in Type II muscle fibers, and this coincided with activation of the mTOR muscle hypertrophy pathway. There was little impact on Type I fiber GLUT4 expression and no evidence of change in mitochondrial biogenesis.
Figures


Similar articles
-
Hexose transporter mRNAs for GLUT4, GLUT5, and GLUT12 predominate in human muscle.Am J Physiol Endocrinol Metab. 2006 Nov;291(5):E1067-73. doi: 10.1152/ajpendo.00250.2006. Epub 2006 Jun 27. Am J Physiol Endocrinol Metab. 2006. PMID: 16803853
-
Insulin responsiveness in metabolic syndrome after eight weeks of cycle training.Med Sci Sports Exerc. 2013 Nov;45(11):2021-9. doi: 10.1249/MSS.0b013e31829a6ce8. Med Sci Sports Exerc. 2013. PMID: 23669880 Free PMC article. Clinical Trial.
-
Impaired muscle AMPK activation in the metabolic syndrome may attenuate improved insulin action after exercise training.J Clin Endocrinol Metab. 2011 Jun;96(6):1815-26. doi: 10.1210/jc.2010-2532. Epub 2011 Apr 20. J Clin Endocrinol Metab. 2011. PMID: 21508135 Free PMC article.
-
GLUT5 expression and fructose transport in human skeletal muscle.Adv Exp Med Biol. 1998;441:35-45. doi: 10.1007/978-1-4899-1928-1_4. Adv Exp Med Biol. 1998. PMID: 9781312 Review.
-
Intracellular organization of insulin signaling and GLUT4 translocation.Recent Prog Horm Res. 2001;56:175-93. doi: 10.1210/rp.56.1.175. Recent Prog Horm Res. 2001. PMID: 11237212 Review.
Cited by
-
Slow-twitch fiber proportion in skeletal muscle correlates with insulin responsiveness.J Clin Endocrinol Metab. 2013 May;98(5):2027-36. doi: 10.1210/jc.2012-3876. Epub 2013 Mar 20. J Clin Endocrinol Metab. 2013. PMID: 23515448 Free PMC article.
-
Lifelong Physical Activity Prevents Aging-Associated Insulin Resistance in Human Skeletal Muscle Myotubes via Increased Glucose Transporter Expression.PLoS One. 2013 Jun 21;8(6):e66628. doi: 10.1371/journal.pone.0066628. Print 2013. PLoS One. 2013. PMID: 23805253 Free PMC article.
-
A Brief Review on Concurrent Training: From Laboratory to the Field.Sports (Basel). 2018 Oct 24;6(4):127. doi: 10.3390/sports6040127. Sports (Basel). 2018. PMID: 30355976 Free PMC article. Review.
-
Conditioning-induced expression of novel glucose transporters in canine skeletal muscle homogenate.PLoS One. 2023 May 3;18(5):e0285424. doi: 10.1371/journal.pone.0285424. eCollection 2023. PLoS One. 2023. PMID: 37134107 Free PMC article.
-
Leukamenin F suppresses liver fibrogenesis by inhibiting both hepatic stellate cell proliferation and extracellular matrix production.Acta Pharmacol Sin. 2010 Jul;31(7):839-48. doi: 10.1038/aps.2010.64. Epub 2010 Jun 21. Acta Pharmacol Sin. 2010. PMID: 20562900 Free PMC article.
References
-
- Allenberg K, Johansen K, Saltin B. Skeletal muscle adaptations to physical training in type II (non-insulin-dependent) diabetes mellitus. Acta Med Scand. 1988;223(4):365–373. - PubMed
-
- Baar K. Involvement of PPAR gamma co-activator-1, nuclear respiratory factors 1 and 2, and PPAR alpha in the adaptive response to endurance exercise. Proc Nutr Soc. 2004;63(2):269–273. - PubMed
-
- Baar K. Training for endurance and strength: lessons from cell signaling. Med Sci Sports Exerc. 2006;38(11):1939–1944. - PubMed
-
- Bodine SC. mTOR signaling and the molecular adaptation to resistance exercise. Med Sci Sports Exerc. 2006;38(11):1950–1957. - PubMed
-
- Campos GE, Luecke TJ, Wendeln HK, et al. Muscular adaptations in response to three different resistance-training regimens: specificity of repetition maximum training zones. Eur J Appl Physiol. 2002;88(1–2):50–60. - PubMed
Publication types
MeSH terms
Substances
Grants and funding
LinkOut - more resources
Full Text Sources
Research Materials
Miscellaneous
