

The nuclear cofactor DOR regulates autophagy in mammalian and Drosophila cells
- PMID: 20010805
- PMCID: PMC2816618
- DOI: 10.1038/embor.2009.242
The nuclear cofactor DOR regulates autophagy in mammalian and Drosophila cells
Abstract
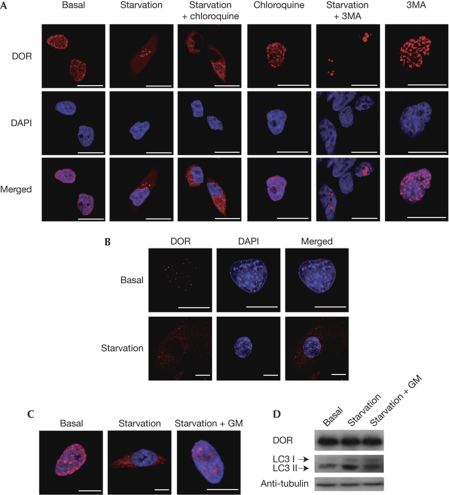
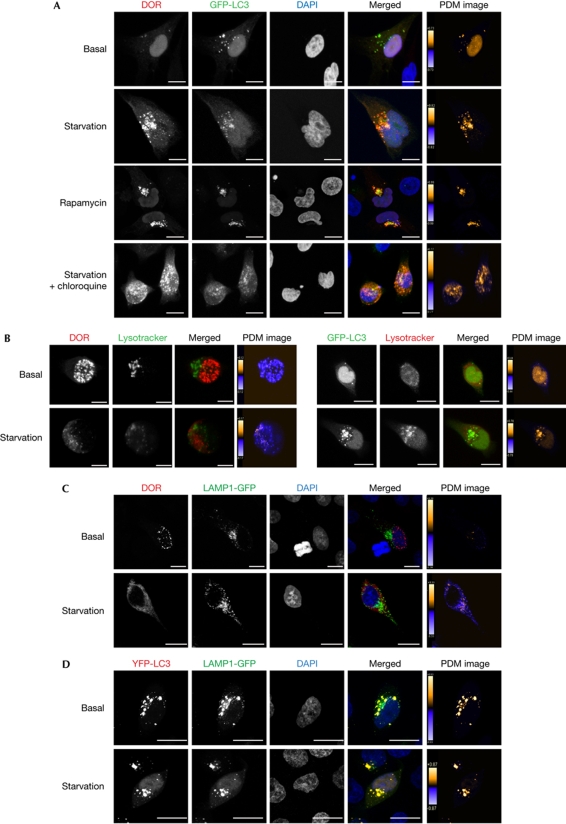
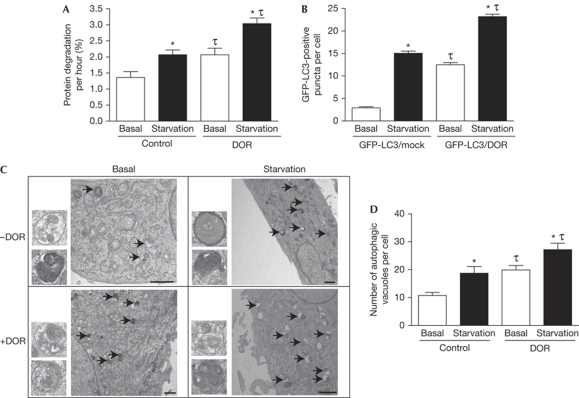
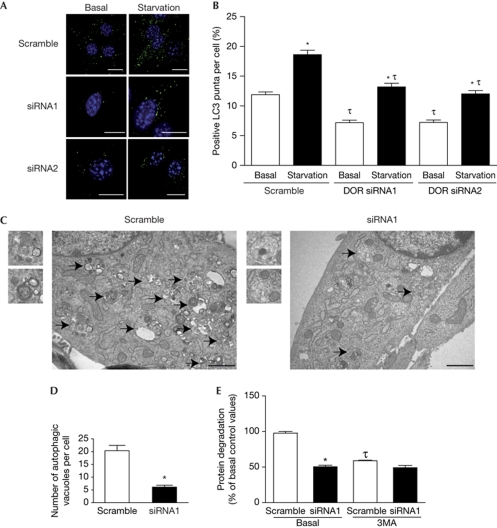
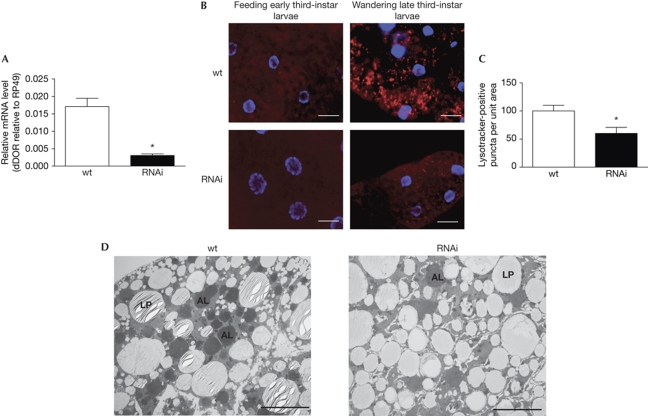
The regulation of autophagy in metazoans is only partly understood, and there is a need to identify the proteins that control this process. The diabetes- and obesity-regulated gene (DOR), a recently reported nuclear cofactor of thyroid hormone receptors, is expressed abundantly in metabolically active tissues such as muscle. Here, we show that DOR shuttles between the nucleus and the cytoplasm, depending on cellular stress conditions, and re-localizes to autophagosomes on autophagy activation. We demonstrate that DOR interacts physically with autophagic proteins Golgi-associated ATPase enhancer of 16 kDa (GATE16) and microtubule-associated protein 1A/1B-light chain 3. Gain-of-function and loss-of-function studies indicate that DOR stimulates autophagosome formation and accelerates the degradation of stable proteins. CG11347, the DOR Drosophila homologue, has been predicted to interact with the Drosophila Atg8 homologues, which suggests functional conservation in autophagy. Flies lacking CG11347 show reduced autophagy in the fat body during pupal development. All together, our data indicate that DOR regulates autophagosome formation and protein degradation in mammalian and Drosophila cells.
Conflict of interest statement
The authors declare that they have no conflict of interest.
Figures
Comment in
-
Opening a new DOR to autophagy.EMBO Rep. 2010 Jan;11(1):4-5. doi: 10.1038/embor.2009.265. EMBO Rep. 2010. PMID: 20033084 Free PMC article. No abstract available.
Similar articles
-
A dual function for Deep orange in programmed autophagy in the Drosophila melanogaster fat body.Exp Cell Res. 2006 Jul 1;312(11):2018-27. doi: 10.1016/j.yexcr.2006.03.002. Epub 2006 Apr 4. Exp Cell Res. 2006. PMID: 16600212
-
Membrane remodeling by the PX-BAR protein SNX18 promotes autophagosome formation.J Cell Biol. 2013 Jul 22;202(2):331-49. doi: 10.1083/jcb.201205129. J Cell Biol. 2013. PMID: 23878278 Free PMC article.
-
TP53INP2 contributes to autophagosome formation by promoting LC3-ATG7 interaction.Autophagy. 2019 Aug;15(8):1309-1321. doi: 10.1080/15548627.2019.1580510. Epub 2019 Feb 20. Autophagy. 2019. PMID: 30767704 Free PMC article.
-
How a RING finger protein and a steroid hormone control autophagy.Autophagy. 2006 Oct-Dec;2(4):321-2. doi: 10.4161/auto.3091. Epub 2006 Oct 14. Autophagy. 2006. PMID: 16874068 Review.
-
Assays to monitor autophagy in Drosophila.Methods. 2014 Jun 15;68(1):134-9. doi: 10.1016/j.ymeth.2014.03.014. Epub 2014 Mar 22. Methods. 2014. PMID: 24667416 Free PMC article. Review.
Cited by
-
Role of diabetes- and obesity-related protein in the regulation of osteoblast differentiation.Am J Physiol Endocrinol Metab. 2011 Jul;301(1):E40-8. doi: 10.1152/ajpendo.00065.2011. Epub 2011 Apr 5. Am J Physiol Endocrinol Metab. 2011. PMID: 21467300 Free PMC article.
-
A systems genetics approach identifies Trp53inp2 as a link between cardiomyocyte glucose utilization and hypertrophic response.Am J Physiol Heart Circ Physiol. 2017 Apr 1;312(4):H728-H741. doi: 10.1152/ajpheart.00068.2016. Epub 2017 Feb 24. Am J Physiol Heart Circ Physiol. 2017. PMID: 28235788 Free PMC article.
-
Histone Methylation, Energy Metabolism, and Alzheimer's Disease.Aging Dis. 2024 Nov 15;16(5):2831-2858. doi: 10.14336/AD.2024.0899. Aging Dis. 2024. PMID: 39656495 Free PMC article. Review.
-
TP53INP2-dependent activation of muscle autophagy ameliorates sarcopenia and promotes healthy aging.Autophagy. 2024 Aug;20(8):1815-1824. doi: 10.1080/15548627.2024.2333717. Epub 2024 Mar 28. Autophagy. 2024. PMID: 38545813 Free PMC article.
-
TP53INP1, a tumor suppressor, interacts with LC3 and ATG8-family proteins through the LC3-interacting region (LIR) and promotes autophagy-dependent cell death.Cell Death Differ. 2012 Sep;19(9):1525-35. doi: 10.1038/cdd.2012.30. Epub 2012 Mar 16. Cell Death Differ. 2012. PMID: 22421968 Free PMC article.
References
-
- Butterworth FM, Emerson L, Rasch EM (1988) Maturation and degeneration of the fat body in the Drosophila larva and pupa as revealed by morphometric analysis. Tissue Cell 20: 255–268 - PubMed
-
- Byfield MP, Murray JT, Backer JM (2005) hVps34 is a nutrient-regulated lipid kinase required for activation of p70 S6 kinase. J Biol Chem 280: 33076–33082 - PubMed
-
- Giot L et al. (2003) A protein interaction map of Drosophila melanogaster. Science 302: 1727–1736 - PubMed
Publication types
MeSH terms
Substances
LinkOut - more resources
Full Text Sources
Medical
Molecular Biology Databases
