. 2010 Jan;13(1):36-44.
doi: 10.1038/nn.2462. Epub 2009 Dec 13.

PIP3 controls synaptic function by maintaining AMPA receptor clustering at the postsynaptic membrane

Affiliations

PIP3 controls synaptic function by maintaining AMPA receptor clustering at the postsynaptic membrane

Kristin L Arendt et al. Nat Neurosci. 2010 Jan.

Abstract

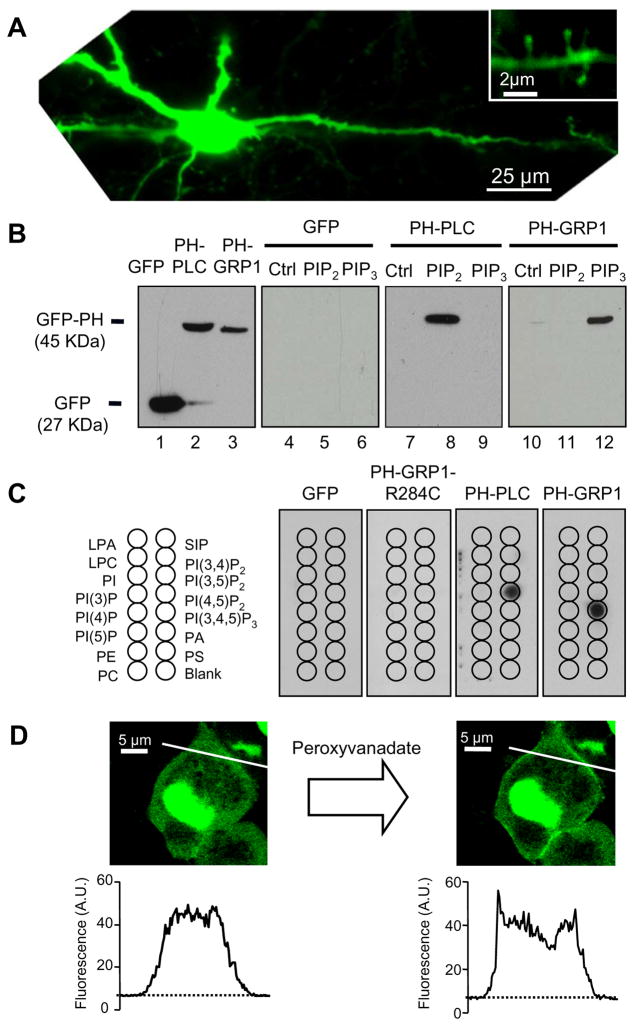
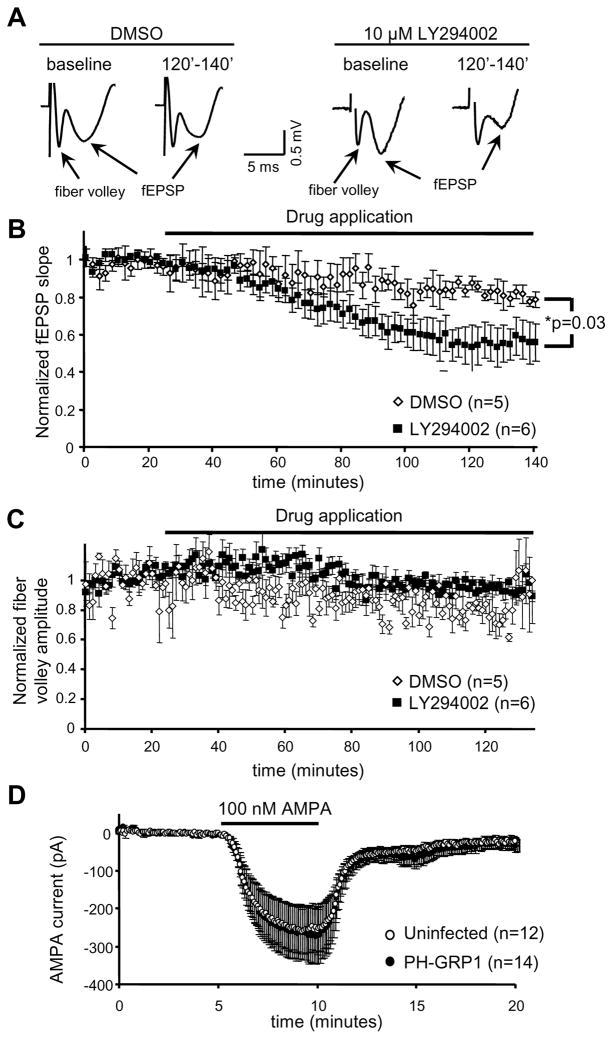
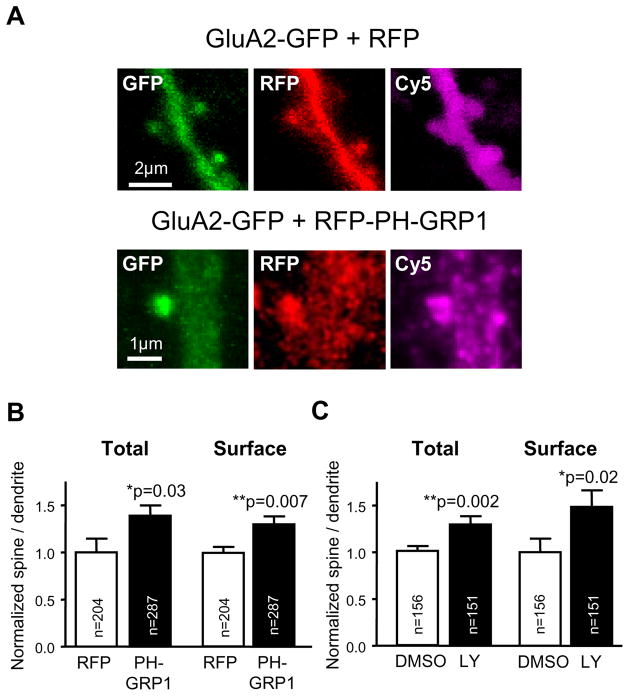
Despite their low abundance, phosphoinositides are critical regulators of intracellular signaling and membrane compartmentalization. However, little is known of phosphoinositide function at the postsynaptic membrane. Here we show that continuous synthesis and availability of phosphatidylinositol-(3,4,5)-trisphosphate (PIP(3)) at the postsynaptic terminal is necessary for sustaining synaptic function in rat hippocampal neurons. This requirement was specific for synaptic, but not extrasynaptic, AMPA receptors, nor for NMDA receptors. PIP(3) downregulation impaired PSD-95 accumulation in spines. Concomitantly, AMPA receptors became more mobile and migrated from the postsynaptic density toward the perisynaptic membrane within the spine, leading to synaptic depression. Notably, these effects were only revealed after prolonged inhibition of PIP(3) synthesis or by direct quenching of this phosphoinositide at the postsynaptic cell. Therefore, we conclude that a slow, but constant, turnover of PIP(3) at synapses is required for maintaining AMPA receptor clustering and synaptic strength under basal conditions.


Figures

Figure 1
Figure 1. Expression of PH-GRP1 in hippocampal neurons and specific binding to PIP3
A Expression of PH-GRP1-GFP in the soma, dendrites, and dendritic spines (inset) of CA1 pyramidal neurons in organotypic cultures. B. Protein extracts from hippocampal slices expressing GFP (lanes 1, 4–6), GFP-PH-PLC (lanes 2, 7–9), or GFP-PH-GRP1 (lanes 3, 10–12) were incubated with agarose beads (Echelon) covalently linked to PIP2 (lanes 5, 8, 11), PIP3 (lanes 6, 9, 12), or control beads (lanes 4, 7, 10). Pull down fractions were analyzed by western blot with anti-GFP antibody (Roche). Input extracts: lanes 1–3. C. Similar extracts to those used in (B) were incubated with membranes spotted with an array of different phospholipids and phosphoinositides (see http://echelon-inc.com for a full list of lipid abbreviations). Membrane bound fractions were visualized with anti-GFP (Roche). D. Representative example of BHK cells expressing GFP-PH-GRP1 before (left) and after (right) stimulation with peroxyvanadate (5 min incubation with 30 μM peroxide, 100 μM ortho-vanadate). Line plots show quantification of fluorescence intensity across the cell. Note accumulation of GFP-PH-GRP1 at the cell edge (plasma membrane) after stimulation.
Figure 2
Figure 2. Bidirectional modulation of AMPA-receptor mediated currents by PIP3
A, B, D, E Comparison of evoked synaptic responses from pairs of neighboring CA1 neurons expressing PH-GRP1 (A, D), PH-GRP1-R284C (B) or Myr-p110 (E), and control (uninfected) neurons recorded at −60 mV (AMPAR EPSCs) and +40 mV (NMDAR EPSCs). Some slices were pre-treated for 1 hour with 10 μM LY-294002 (D). Example traces from uninfected and infected neurons are shown on the left for all panels. “n” represents number of cell pairs. Statistical significance was calculated according to the Wilcoxon text for paired data (individual pairs of infected versus uninfected cells). C. Comparison of evoked synaptic responses from CA1 neurons pre-treated for 1 hour with 10 μM LY-294002 (“LY”) or 100 nM wortmannin (“Wrt”) or with the vehicle control (0.05% DMSO). The AMPA/NMDA ratio is calculated from the size of the AMPAR- and NMDAR-mediated responses recorded at −60 mV and +40 mV, respectively. Experiments were carried out on organotypic cultured slices (left histrogram) or on acute slices (14 days postnatal; right histogram). Representative traces are shown on the left. “n” represents number of cells; “p” values were calculated according to the Mann-Whitney test. In all cases, error bars represent s.e.m.
Figure 3
Figure 3. Inhibition of PIP3 synthesis produces a slow and gradual depression of AMPA receptor-mediated transmission
A. Examples of evoked field excitatory postsynaptic potentials (fEPSP) obtained from hippocampal slices 5–25 minutes before (“baseline”) or 120–140 minutes after (“120–140”) treatment with DMSO (left) or 10 μM LY294002 (right). Presynaptic fiber volleys and fEPSPs are indicated with arrows. B. Time course of the slope of fEPSP responses from hippocampal slices treated with 10 μM LY294002 (black symbols) or DMSO (white symbols) (drug application is shown with a black bar). Values are normalized to the average slope before drug application. “n” represents number of slices. Statistical significance for the comparison between DMSO- and LY294002-treated slices was done according to the Mann-Whitney test. C. The amplitude of the presynaptic fiber volley was analyzed from the experiments shown in B. Values are normalized to the average fiber volley amplitude before drug application. No significant change in fiber volley amplitude was observed over the time course. D. Time course of whole-cell currents recorded from CA1 pyramidal neurons infected with PH-GRP1 (black symbols) or uninfected control neurons (white symbols) during the application of 100 nM AMPA (bar). “n” represents number of cells. In all cases, error bars represent s.e.m.
Figure 4
Figure 4. PIP3 is required for LTP and it affects both constitutively cycling and regulated populations of AMPA receptors
A. Time course of AMPAR-mediated synaptic responses before and after LTP induction (black arrow) in control (uninfected) CA1 neurons (white symbols) and in PH-GRP1-expressing cells (black symbols). B. Quantification of average synaptic potentiation (“LTP Pathway”) from the last 5 min of the time course shown in A. One of the stimulating electrodes was turned off during LTP induction (“Unpaired Pathway”). C. CA1 neurons were transfected with different combinations of GluA2(R607Q) or GluA1 plus constitutively active CaMKII (tCaMKII), together with RFP or RFP-PH-GRP1 coexpression, as indicated. Synaptic responses were evoked at −60 mV and +40 mV to quantify inward rectification. Rectification indexes were normalized to the average value obtained from untransfected cells (2.0 ± 0.3). Representative traces of the recordings are plotted above their respective columns in the graph (scale bars: 20 pA, 10 ms). D. Similar experiments as in C, with the indicated recombinant proteins and slices treated with 10 μM LY294002 or DMSO (vehicle control) for 1 hour (LY294002 and DMSO were also present during the recordings). Rectification index for uninfected, DMSO-treated cell was 2.4 ± 0.2. Representative traces of the recordings are plotted above their respective columns in the graph (scale bars: 20 pA, 10 ms). In all cases, “n” stands for the number of cells, error bars represent s.e.m. and statistical significance was calculated according to the Mann-Whitney test.
Figure 5
Figure 5. Depletion of PIP3 leads to the accumulation of AMPA receptors in dendritic spines
A Representative confocal images of total receptor (“GFP”, green) and surface anti-GFP labeling (“Cy5”, purple) in dendritic spines from neurons expressing GluA2-GFP with RFP (top panels) or with RFP-PH-GRP1 (bottom panels). B. Quantification of fluorescence intensity at spines versus the adjacent dendritic shaft from neurons as those shown in A. “Total Receptor” (left) is quantified from GFP fluorescence, and “Surface Receptor” (right) from Cy5 signal. Values of spine/dendrite ratios are normalized to the control (RFP-expressing neurons). The actual (non-normalized) ratios for the control were (average ±s.e.m.): 1.15 ±0.2 (total) and 1.0 ± 0.1 (surface). “n” represents number of spines from 11 (GluA2 + RFP) or 25 (GluA2 + PH-GRP1) different neurons. Statistical significance was calculated according to t test. C. Neurons expressing GluA2-GFP were treated with 10 μM LY294002 or DMSO (vehicle control) for 1 hour prior to fixation and imaging. Total and surface receptors are plotted as in B. Values of spine/dendrite ratios are normalized to the control (DMSO-treated neurons). The actual (non-normalized) values for the control were (average ± s.e.m.): 1.5 ±0.1 (total), 1.1 ±0.2 (surface). “n” represents number of spines from 25 (DMSO) or 22 (LY294002) different neurons. Statistical significance was calculated according to t test.
Figure 6
Figure 6. Depletion of PIP3 impairs PSD-95 accumulation in spines and increases surface mobility of GluA2 recombinant receptors
A. Representative confocal images of dendritic spines from neurons expressing PSD-95-GFP (green images) with RFP (top panels) or with RFP-PH-GRP1 (bottom panels). B. Quantification of fluorescence intensity at spines versus the adjacent dendritic shaft from neurons as those shown in A. “n” represents number of spines from 29 (PSD-95 + RFP) or 12 (PSD-95 + PH-GRP1) different neurons. Data are presented as cumulative distributions of spine/dendrite ratios (average spine/dendrite ratio ± s.e.m. was 3.7±0.15 for PSD-95 + RFP, and 2.6±0.15 for PSD-95 + PH-GRP1). Statistical significance is calculated according to the Kolmogorov-Smirnov test. C. Examples of spines expressing GFP-GluA2, treated with either DMSO (vehicle) or 10 μM LY49002 for 1 hour prior to undergoing a FRAP experiment. Representative images are shown before photobleaching (“Baseline”), right after photobleaching (“Bleach”) and at different times during fluorescence recovery, as indicated. Bleached regions are indicated with dashed circles in the “Baseline” panels. D. Quantification of the amount of GluA2-GFP fluorescence at the spine normalized to the baseline value before photobleaching. Fluorescence intensity at the spine is normalized to the adjacent dendrite (spine/dendrite ratio) to compensate for ongoing photobleaching during image acquisition. Time courses obtained from DMSO- (white symbols) or LY294002-treated slices (black symbols) were fitted to single exponentials (solid lines). Best-fit parameters were: τ=5.7 min, amplitude=0.26 (DMSO); τ=5.9 min, amplitude=0.52 (LY294002). Correlation coefficients were 0.71 (DMSO) and 0.84 (LY294002). Error bars represent s.e.m.
Figure 7
Figure 7. Depletion of PIP3 causes a redistribution of AMPARs between the PSD and extrasynaptic membrane
A. Examples of electron micrographs from CA1 excitatory synapses labeled with anti-GluA2 immunogold (arrows). Presynaptic terminals are indicated with asterisks. Slices were treated with either DMSO (vehicle) or 10 μM LY294002 for 1 hour before fixation. Scale bars represent 100 nm. B. Quantification of GluA2 immunogold abundance at the PSD, the extrasynaptic membrane (“Extra”) or the intracellular space (“Intra”) from slices treated with DMSO (grey columns) or LY294002 (black columns). The number of gold particles at each compartment for a given synapse was divided by the total number of gold particles in that synapse. Average values ± s.e.m. are plotted for each compartment. “n” represents number of synapses analyzed. Statistical significance is calculated with the Mann-Whitney test. C. Frequency histogram of the lateral distribution of GluA2 immunogold particles contained within the PSD or the extrasynaptic membrane. Lateral distances are calculated for individual gold particles with respect to the closest PSD edge, with negative distances for particles within the PSD and positive distances for particles within the extrasynaptic membrane. Only particles within 290 nm (average PSD length) were considered for this analysis. Values are plotted for DMSO- (grey) and LY294002-treated slices (black). “n” represents number of gold particles. Statistical significance was calculated with a χ2 test (contingency table). D. The same values shown in C are plotted as cumulative distributions. “n” represents number of gold particles. Statistical significance is calculated with the Kolmogorov-Smirnov test.
Figure 8
Figure 8. Inhibition of glutamate reuptake abolishes PH-GRP1-induced depression of AMPA receptor-mediated transmission
A. Comparison of evoked AMPAR responses from pairs of neighboring CA1 neurons expressing PH-GRP1 and control (uninfected) neurons after treatment with 100 μM L-trans-pyrrolidine-2,4-dicarboxylate (L-t-PDC). L-t-PDC was added to the slice cultures 30 min before starting the recordings, and was also present during the recordings. “n” represents number of cell pairs. Average amplitudes (±s.e.m.) of AMPAR responses from pairs of uninfected and infected neurons are indicated. B. Time course of AMPAR-mediated EPSCs from hippocampal CA1 neurons expressing PH-GRP1 (black symbols) or from control uninfected neurons (white symbols), in response to the addition of 100 μM L-t-PDC (indicated with an arrow). Values are normalized to the average EPSC amplitude before drug application. “n” represents number of cells. Statistical significance for the comparison between uninfected and PH-GRP1-expressing neurons was done according to the Mann-Whitney test. Error bars represent s.e.m. Inset. Representative traces from a pair of uninfected and PH-GRP1-expressing neurons recorded simultaneously during drug application. Thin lines: average response before L-t-PDC application. Thick lines: average response from the last 5 min of the time course.

References

    1. Cantley LC. The phosphoinositide 3-kinase pathway. Science. 2002;296:1655–7. - PubMed
    1. Di Paolo G, De Camilli P. Phosphoinositides in cell regulation and membrane dynamics. Nature. 2006;443:651–7. - PubMed
    1. Wenk MR, De Camilli P. Protein-lipid interactions and phosphoinositide metabolism in membrane traffic: insights from vesicle recycling in nerve terminals. Proc Natl Acad Sci U S A. 2004;101:8262–9. - PMC - PubMed
    1. Sanna PP, et al. Phosphatidylinositol 3-kinase is required for the expression but not for the induction or the maintenance of long-term potentiation in the hippocampal CA1 region. J Neurosci. 2002;22:3359–65. - PMC - PubMed
    1. Opazo P, Watabe AM, Grant SG, O’Dell TJ. Phosphatidylinositol 3-kinase regulates the induction of long-term potentiation through extracellular signal-related kinase-independent mechanisms. J Neurosci. 2003;23:3679–88. - PMC - PubMed

Publication types

MeSH terms

Substances