

Label-free biomarker detection from whole blood
- PMID: 20010825
- PMCID: PMC2818341
- DOI: 10.1038/nnano.2009.353
Label-free biomarker detection from whole blood
Abstract
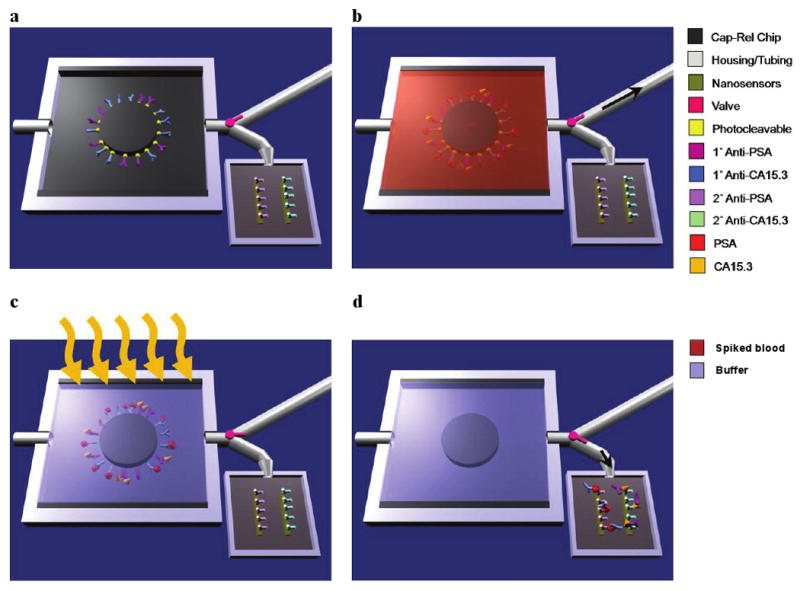
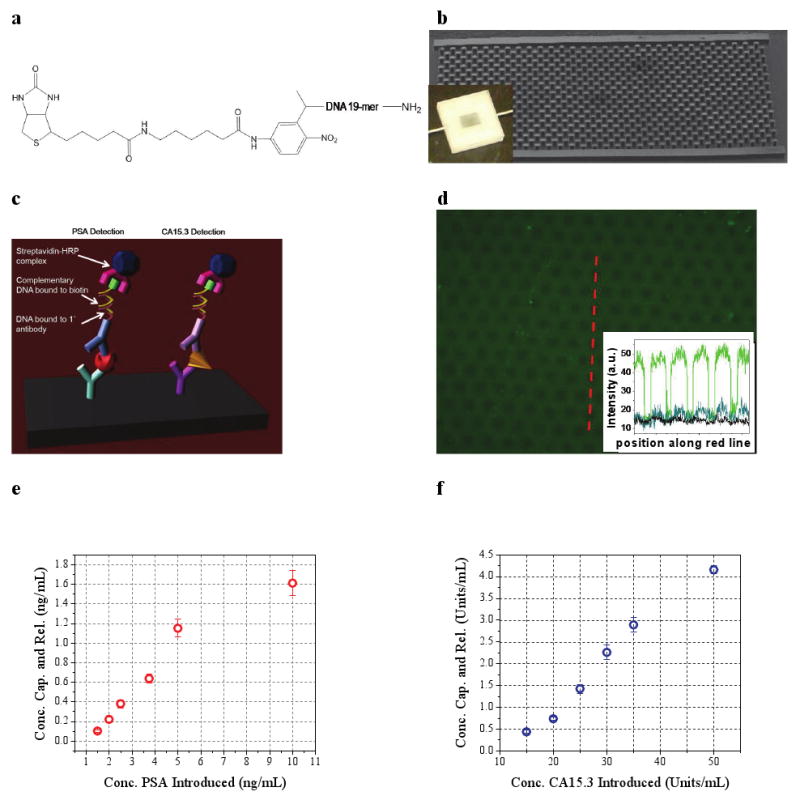
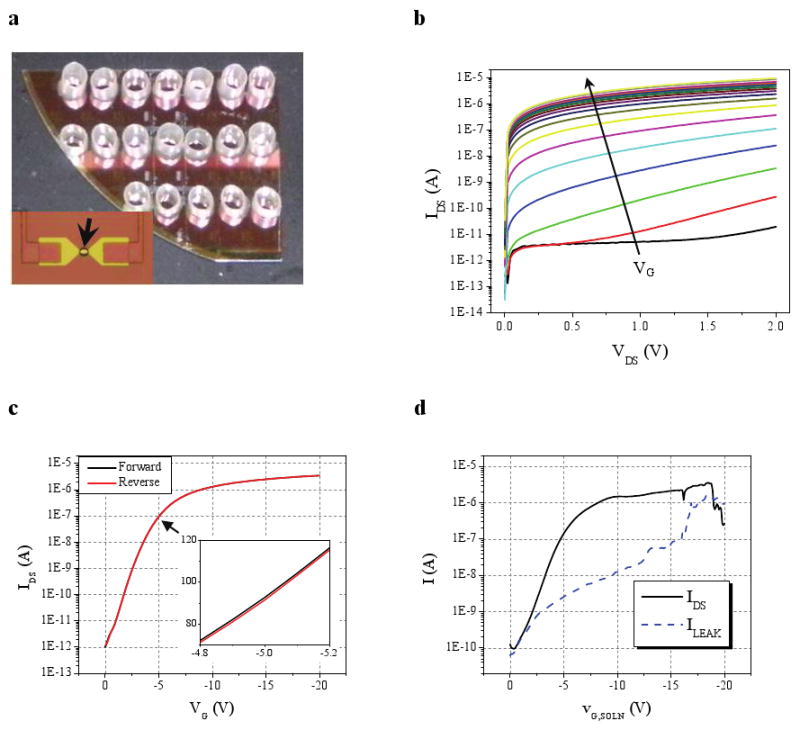
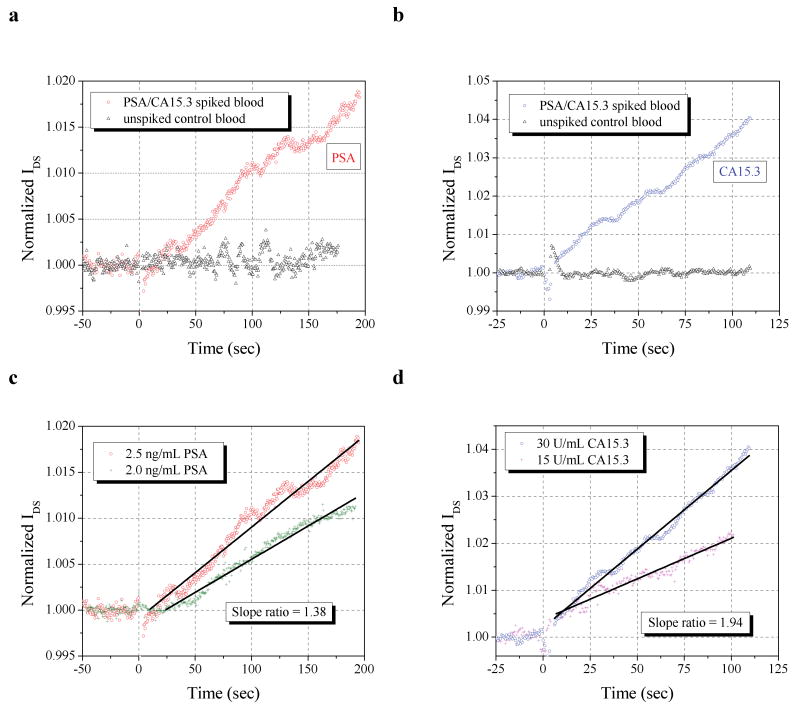
Label-free nanosensors can detect disease markers to provide point-of-care diagnosis that is low-cost, rapid, specific and sensitive. However, detecting these biomarkers in physiological fluid samples is difficult because of problems such as biofouling and non-specific binding, and the resulting need to use purified buffers greatly reduces the clinical relevance of these sensors. Here, we overcome this limitation by using distinct components within the sensor to perform purification and detection. A microfluidic purification chip simultaneously captures multiple biomarkers from blood samples and releases them, after washing, into purified buffer for sensing by a silicon nanoribbon detector. This two-stage approach isolates the detector from the complex environment of whole blood, and reduces its minimum required sensitivity by effectively pre-concentrating the biomarkers. We show specific and quantitative detection of two model cancer antigens from a 10 microl sample of whole blood in less than 20 min. This study marks the first use of label-free nanosensors with physiological solutions, positioning this technology for rapid translation to clinical settings.
Figures
Similar articles
-
Blood Biomarker Detection Using Integrated Microfluidics with Optical Label-Free Biosensor.Sensors (Basel). 2024 Oct 21;24(20):6756. doi: 10.3390/s24206756. Sensors (Basel). 2024. PMID: 39460236 Free PMC article.
-
Immunoassays in microfluidic systems.Anal Bioanal Chem. 2010 Jun;397(3):991-1007. doi: 10.1007/s00216-010-3678-8. Epub 2010 Apr 27. Anal Bioanal Chem. 2010. PMID: 20422163 Review.
-
Microfluidic Arrayed Lab-On-A-Chip for Electrochemical Capacitive Detection of DNA Hybridization Events.Methods Mol Biol. 2017;1572:71-88. doi: 10.1007/978-1-4939-6911-1_6. Methods Mol Biol. 2017. PMID: 28299682
-
Top-down nanofabrication of silicon nanoribbon field effect transistor (Si-NR FET) for carcinoembryonic antigen detection.Int J Nanomedicine. 2017 Jun 27;12:4623-4631. doi: 10.2147/IJN.S135985. eCollection 2017. Int J Nanomedicine. 2017. PMID: 28721039 Free PMC article.
-
Label-free electrochemical microfluidic biosensors: futuristic point-of-care analytical devices for monitoring diseases.Mikrochim Acta. 2022 Jun 10;189(7):252. doi: 10.1007/s00604-022-05316-3. Mikrochim Acta. 2022. PMID: 35687204 Review.
Cited by
-
Droplet-based Biosensing for Lab-on-a-Chip, Open Microfluidics Platforms.Biosensors (Basel). 2016 Apr 14;6(2):14. doi: 10.3390/bios6020014. Biosensors (Basel). 2016. PMID: 27089377 Free PMC article. Review.
-
Nanomaterial-Based Biosensors using Field-Effect Transistors: A Review.J Electron Mater. 2022;51(5):1950-1973. doi: 10.1007/s11664-022-09492-z. Epub 2022 Feb 26. J Electron Mater. 2022. PMID: 35250154 Free PMC article. Review.
-
Application of microfluidic chips in anticancer drug screening.Bosn J Basic Med Sci. 2022 Jun 1;22(3):302-314. doi: 10.17305/bjbms.2021.6484. Bosn J Basic Med Sci. 2022. PMID: 34627135 Free PMC article. Review.
-
Recent Advancements in Electrochemical Biosensors for Monitoring the Water Quality.Biosensors (Basel). 2022 Jul 21;12(7):551. doi: 10.3390/bios12070551. Biosensors (Basel). 2022. PMID: 35884353 Free PMC article. Review.
-
Stimuli-responsive reagent system for enabling microfluidic immunoassays with biomarker purification and enrichment.Bioconjug Chem. 2015 Jan 21;26(1):29-38. doi: 10.1021/bc500522k. Epub 2014 Dec 24. Bioconjug Chem. 2015. PMID: 25405605 Free PMC article.
References
Publication types
MeSH terms
Substances
Grants and funding
LinkOut - more resources
Full Text Sources
Other Literature Sources
