. 2010 Jan;42(1):45-52.
doi: 10.1038/ng.500. Epub 2009 Dec 13.

Meta-analyses of genome-wide association studies identify multiple loci associated with pulmonary function

Affiliations

Meta-analyses of genome-wide association studies identify multiple loci associated with pulmonary function

Dana B Hancock et al. Nat Genet. 2010 Jan.

Abstract

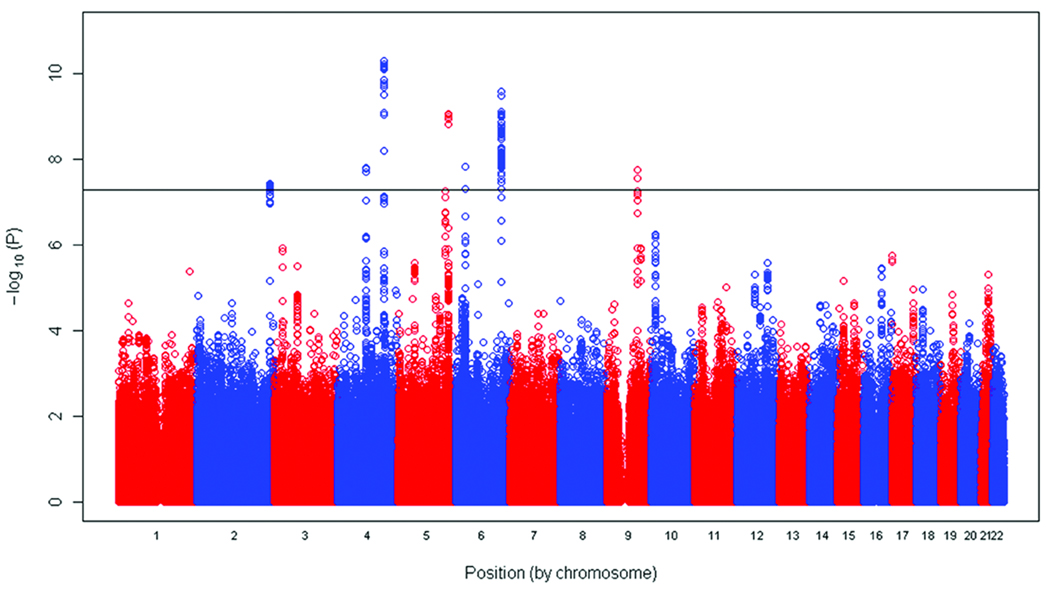
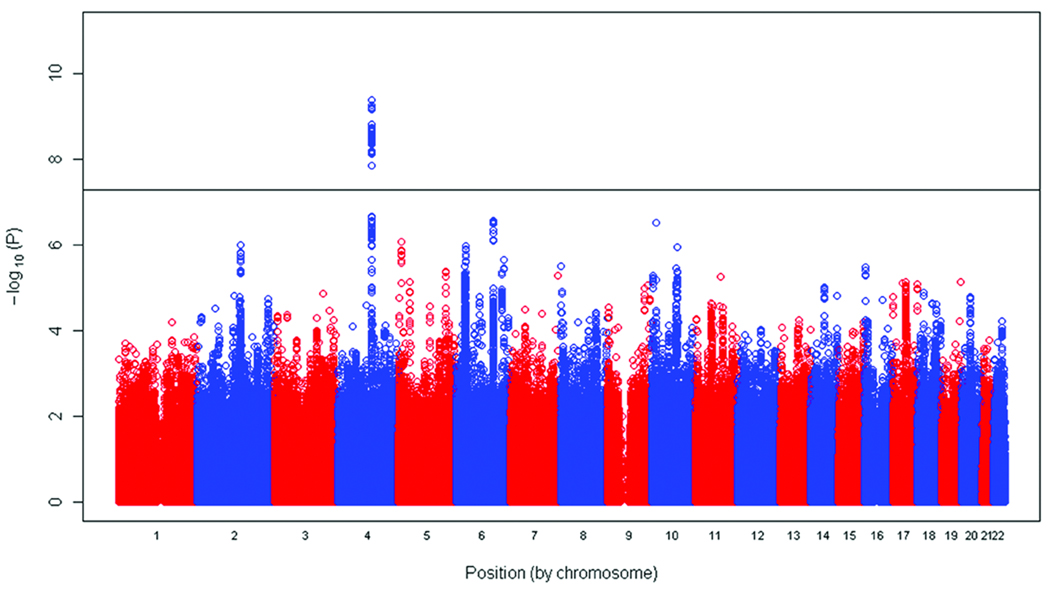
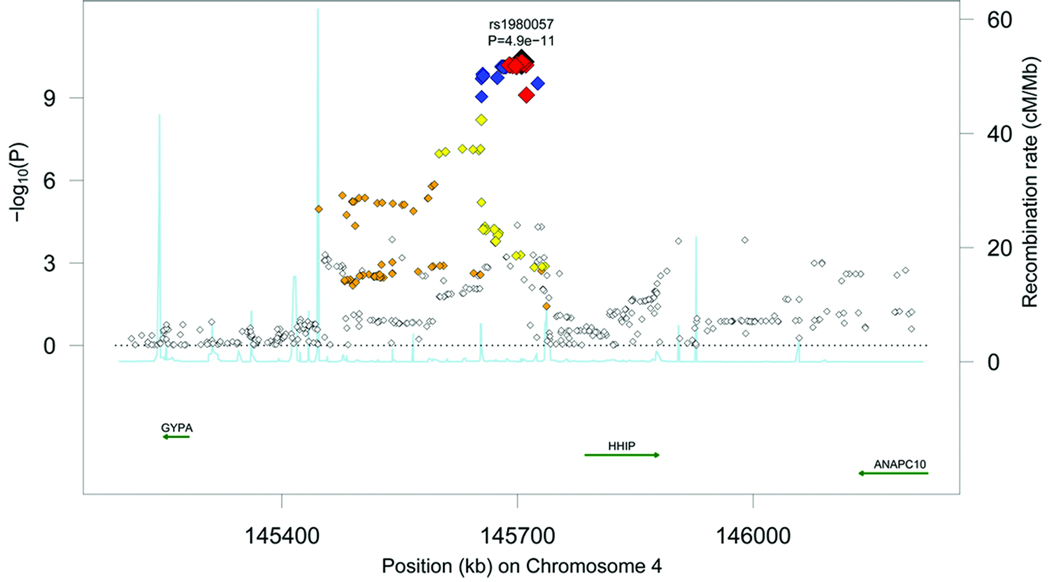
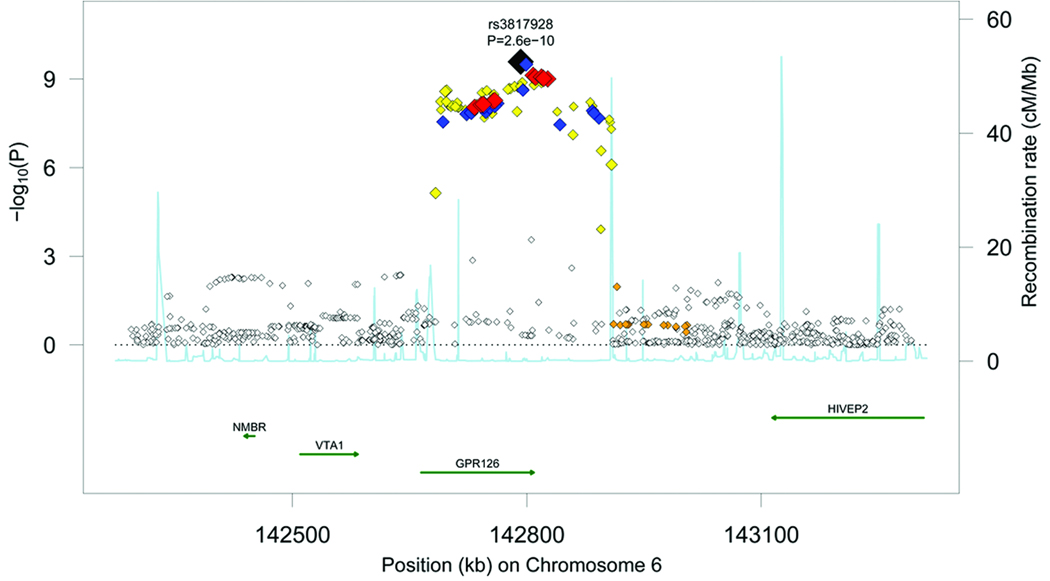
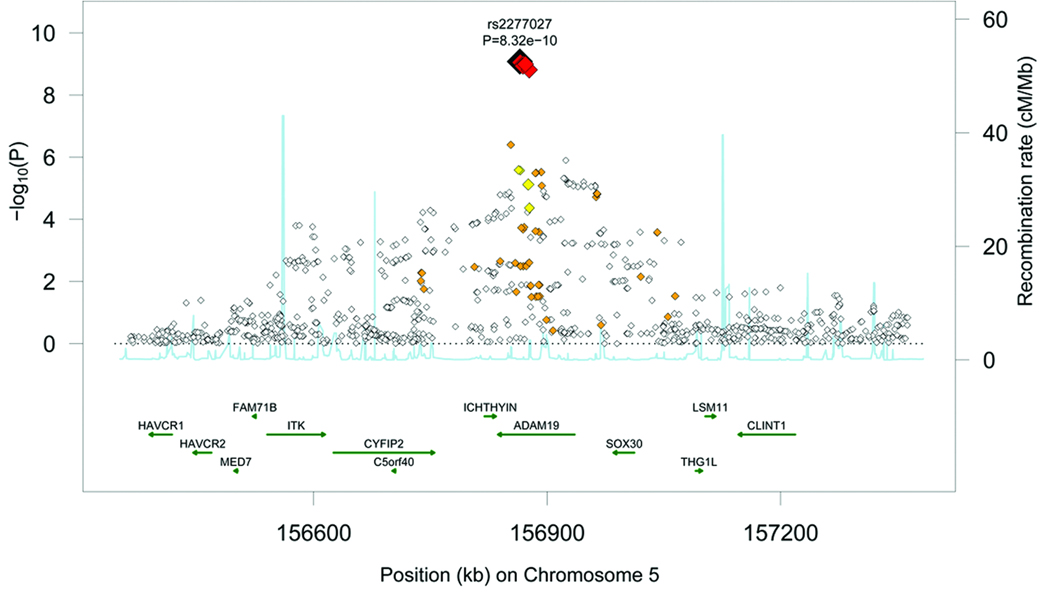
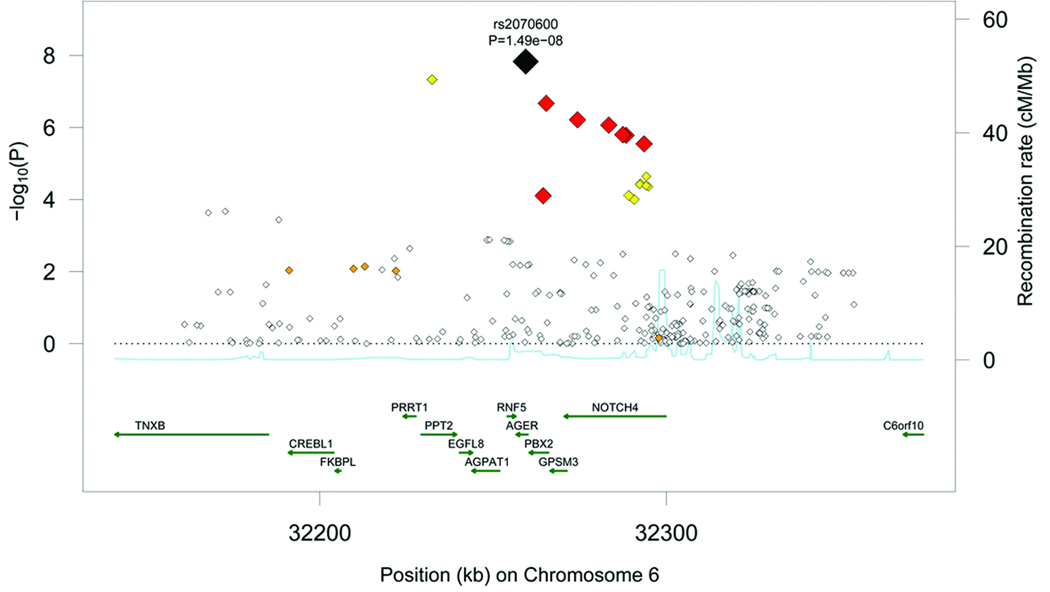
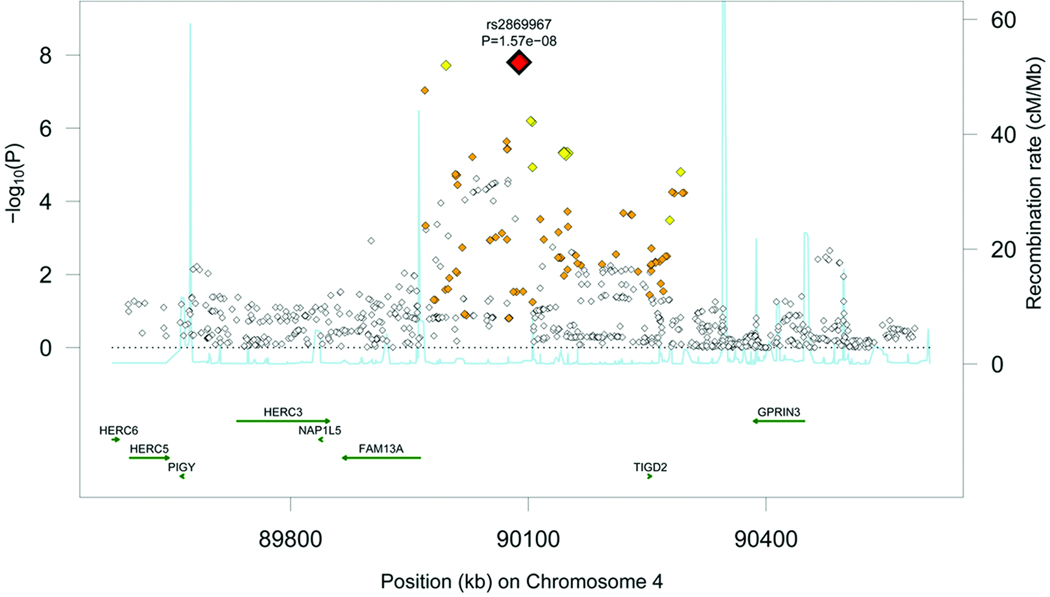
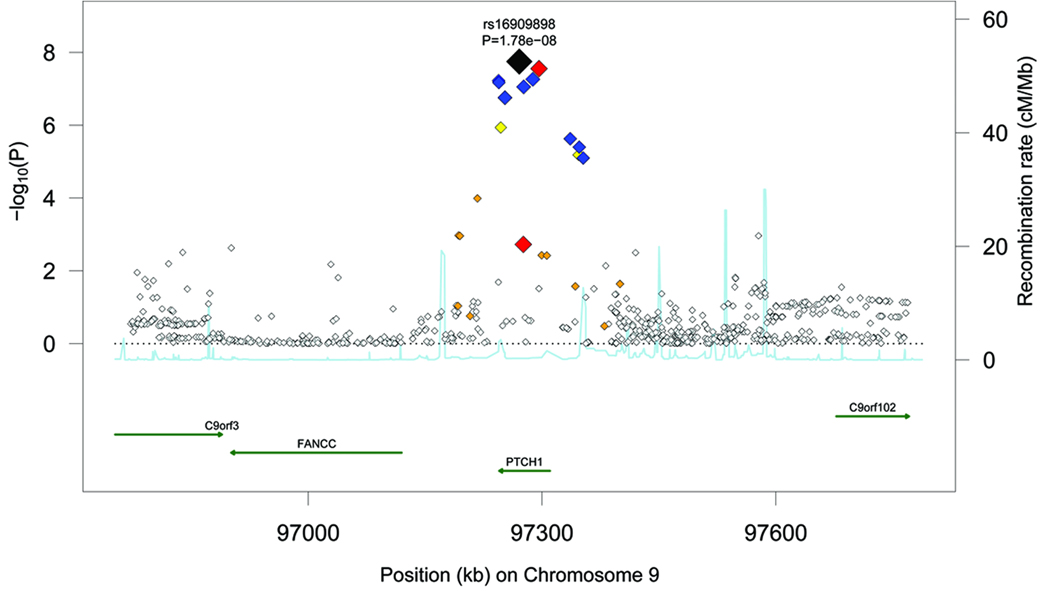
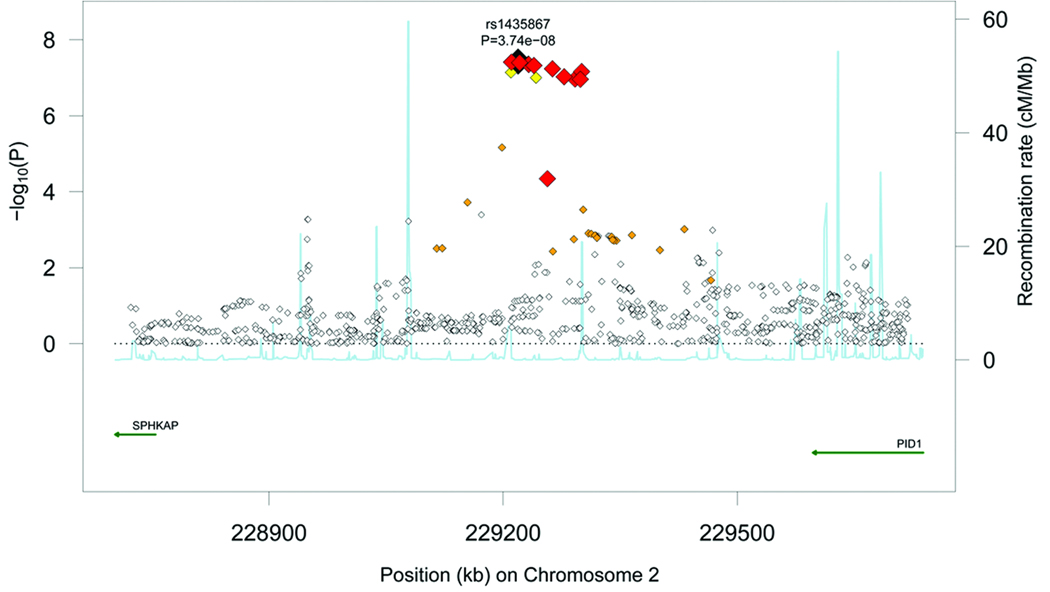
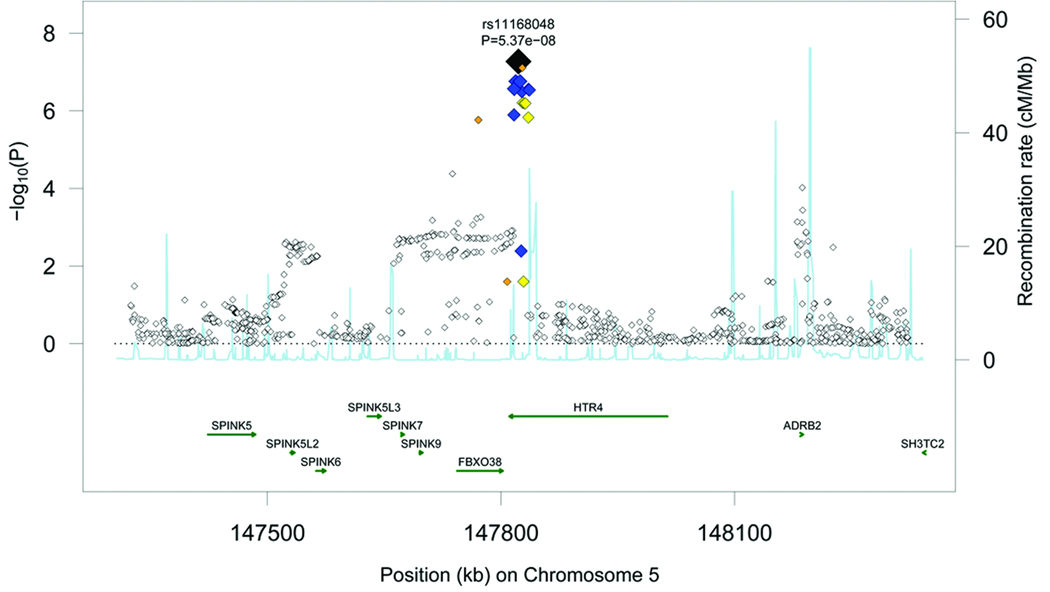
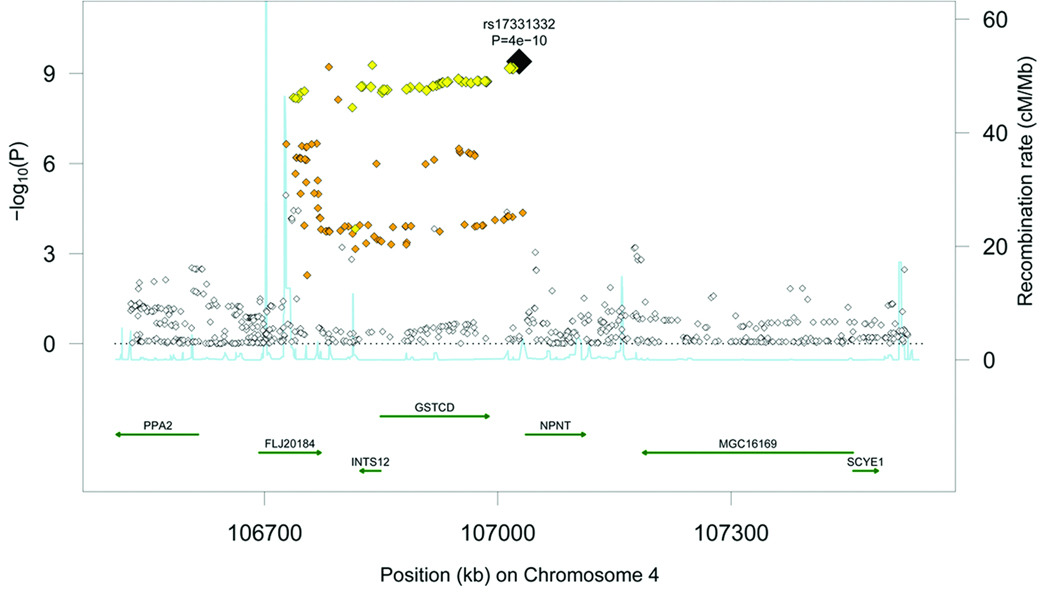
Spirometric measures of lung function are heritable traits that reflect respiratory health and predict morbidity and mortality. We meta-analyzed genome-wide association studies for two clinically important lung-function measures: forced expiratory volume in the first second (FEV(1)) and its ratio to forced vital capacity (FEV(1)/FVC), an indicator of airflow obstruction. This meta-analysis included 20,890 participants of European ancestry from four CHARGE Consortium studies: Atherosclerosis Risk in Communities, Cardiovascular Health Study, Framingham Heart Study and Rotterdam Study. We identified eight loci associated with FEV(1)/FVC (HHIP, GPR126, ADAM19, AGER-PPT2, FAM13A, PTCH1, PID1 and HTR4) and one locus associated with FEV(1) (INTS12-GSTCD-NPNT) at or near genome-wide significance (P < 5 x 10(-8)) in the CHARGE Consortium dataset. Our findings may offer insights into pulmonary function and pathogenesis of chronic lung disease.


Figures

Figure 1
Figure 1
Meta-analyses of approximately 2,534,500 SNPs tested for association with (a) FEV1/FVC and (b) FEV1 in all participants from the CHARGE consortium. The Manhattan plots (also known as –log10 (P) association plots) show the chromosomal position of SNPs exceeding the genome-wide significance threshold (P<5×10⁻⁸ as indicated by the solid black line).
Figure 1
Figure 1
Meta-analyses of approximately 2,534,500 SNPs tested for association with (a) FEV1/FVC and (b) FEV1 in all participants from the CHARGE consortium. The Manhattan plots (also known as –log10 (P) association plots) show the chromosomal position of SNPs exceeding the genome-wide significance threshold (P<5×10⁻⁸ as indicated by the solid black line).
Figure 2
Figure 2
Regional association plots for loci associated with FEV1/FVC in the CHARGE consortium at or near genome-wide significance, including (a) HHIP on chromosome 4q31.22, (b) GPR126 on chromosome 6q24.1, (c) ADAM19 on chromosome 5q33.3, (d) AGER-PPT2 on chromosome 6p21.32, (e) FAM13A on chromosome 4q22.1, (f) PTCH1 on chromosome 9q22.32, (g) PID1 on chromosome 2q36.3, and (h) HTR4 on chromosome 5q33.1. For each locus, correlations between the target SNP (the SNP with the lowest P value depicted in black) and other SNPs in the region are depicted in red when r2=1, blue when 0.8≤r2<1, yellow when 0.5≤r2<0.8, orange when 0.2 ≤r2<0.5, and white when r2<0.2. The r2 values were based on the HapMap CEU population. Gene annotations are shown in green, and estimated recombination rates from HapMap are shown in light blue.
Figure 2
Figure 2
Regional association plots for loci associated with FEV1/FVC in the CHARGE consortium at or near genome-wide significance, including (a) HHIP on chromosome 4q31.22, (b) GPR126 on chromosome 6q24.1, (c) ADAM19 on chromosome 5q33.3, (d) AGER-PPT2 on chromosome 6p21.32, (e) FAM13A on chromosome 4q22.1, (f) PTCH1 on chromosome 9q22.32, (g) PID1 on chromosome 2q36.3, and (h) HTR4 on chromosome 5q33.1. For each locus, correlations between the target SNP (the SNP with the lowest P value depicted in black) and other SNPs in the region are depicted in red when r2=1, blue when 0.8≤r2<1, yellow when 0.5≤r2<0.8, orange when 0.2 ≤r2<0.5, and white when r2<0.2. The r2 values were based on the HapMap CEU population. Gene annotations are shown in green, and estimated recombination rates from HapMap are shown in light blue.
Figure 3
Figure 3
Regional association plot for the chromosome 4q24 locus associated with FEV1 in the CHARGE consortium at genome-wide significance, which includes FLJ20184, INTS12, GSTCD, and NPNT. Correlations between the target SNP (the SNP with the lowest P value depicted in black) and other SNPs in the region are depicted in red when r2=1, blue when 0.8≤r2<1, yellow when 0.5≤r2<0.8, orange when 0.2 ≤r2<0.5, and white when r2<0.2. The r2 values were based on the HapMap CEU population. Gene annotations are shown in green, and estimated recombination rates from HapMap are shown in light blue.

Comment in

References

    1. Wilk JB, et al. Evidence for major genes influencing pulmonary function in the NHLBI family heart study. Genet Epidemiol. 2000;19:81–94. - PubMed
    1. Hole DJ, et al. Impaired lung function and mortality risk in men and women: findings from the Renfrew and Paisley prospective population study. BMJ. 1996;313:711–716. - PMC - PubMed
    1. Schunemann HJ, Dorn J, Grant BJ, Winkelstein W, Jr, Trevisan M. Pulmonary function is a long-term predictor of mortality in the general population: 29-year follow-up of the Buffalo Health Study. Chest. 2000;118:656–664. - PubMed
    1. DeMeo DL, Silverman EK. Genetics of chronic obstructive pulmonary disease. Semin Respir Crit Care Med. 2003;24:151–160. - PubMed
    1. Pauwels RA, Buist AS, Calverley PM, Jenkins CR, Hurd SS. Global strategy for the diagnosis, management, and prevention of chronic obstructive pulmonary disease. NHLBI/WHO Global Initiative for Chronic Obstructive Lung Disease (GOLD) Workshop summary. Am J Respir Crit Care Med. 2001;163:1256–1276. - PubMed

Publication types

Grants and funding