

TCR and Lat are expressed on separate protein islands on T cell membranes and concatenate during activation
- PMID: 20010844
- PMCID: PMC3273422
- DOI: 10.1038/ni.1832
TCR and Lat are expressed on separate protein islands on T cell membranes and concatenate during activation
Erratum in
- Nat Immunol. 2010 Jun;11(6):543
Abstract
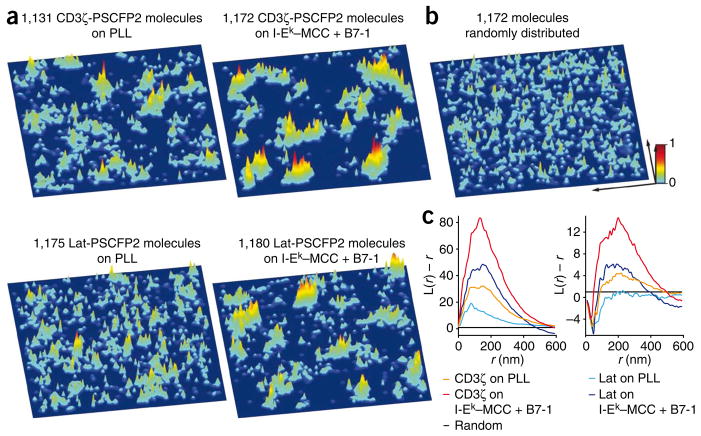
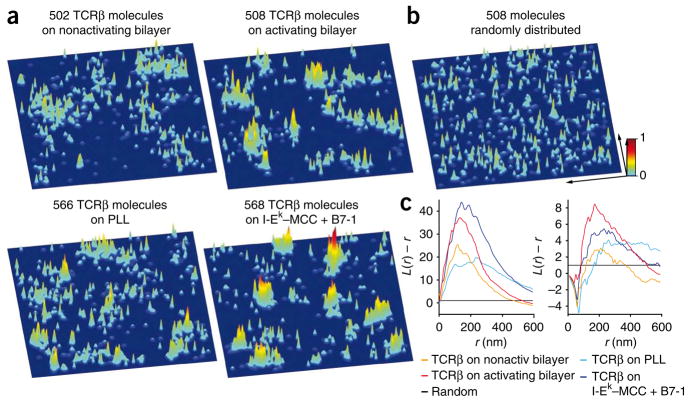
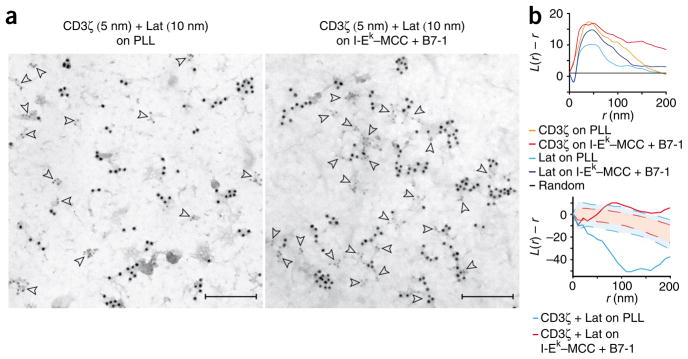
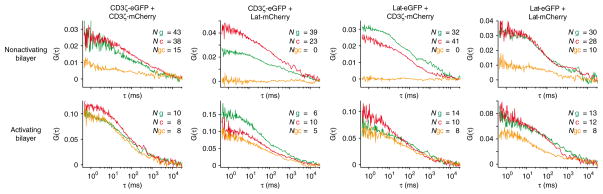
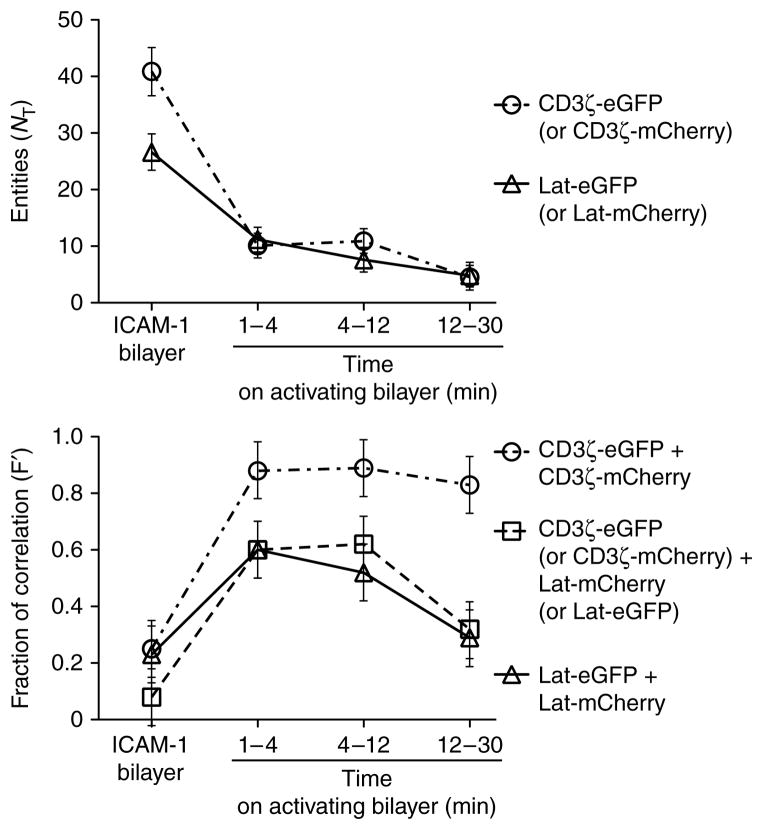
The organization and dynamics of receptors and other molecules in the plasma membrane are not well understood. Here we analyzed the spatio-temporal dynamics of T cell antigen receptor (TCR) complexes and linker for activation of T cells (Lat), a key adaptor molecule in the TCR signaling pathway, in T cell membranes using high-speed photoactivated localization microscopy, dual-color fluorescence cross-correlation spectroscopy and transmission electron microscopy. In quiescent T cells, both molecules existed in separate membrane domains (protein islands), and these domains concatenated after T cell activation. These concatemers were identical to signaling microclusters, a prominent hallmark of T cell activation. This separation versus physical juxtapositioning of receptor domains and domains containing downstream signaling molecules in quiescent versus activated T cells may be a general feature of plasma membrane-associated signal transduction.
Figures
Comment in
-
Taking T cells beyond the diffraction limit.Nat Immunol. 2010 Jan;11(1):51-2. doi: 10.1038/ni0110-51. Nat Immunol. 2010. PMID: 20016513 No abstract available.
Similar articles
-
Taking T cells beyond the diffraction limit.Nat Immunol. 2010 Jan;11(1):51-2. doi: 10.1038/ni0110-51. Nat Immunol. 2010. PMID: 20016513 No abstract available.
-
T-cell receptor microclusters critical for T-cell activation are formed independently of lipid raft clustering.Mol Cell Biol. 2010 Jul;30(14):3421-9. doi: 10.1128/MCB.00160-10. Epub 2010 May 24. Mol Cell Biol. 2010. PMID: 20498282 Free PMC article.
-
Recruitment of SLP-76 to the membrane and glycolipid-enriched membrane microdomains replaces the requirement for linker for activation of T cells in T cell receptor signaling.J Exp Med. 2000 Oct 2;192(7):1047-58. doi: 10.1084/jem.192.7.1047. J Exp Med. 2000. PMID: 11015445 Free PMC article.
-
Optical techniques for imaging membrane domains in live cells (live-cell palm of protein clustering).Methods Enzymol. 2012;504:221-35. doi: 10.1016/B978-0-12-391857-4.00011-2. Methods Enzymol. 2012. PMID: 22264537 Review.
-
T cell activation at the immunological synapse: vesicles emerge for LATer signaling.Sci Signal. 2010 May 11;3(121):pe16. doi: 10.1126/scisignal.3121pe16. Sci Signal. 2010. PMID: 20460646 Review.
Cited by
-
Dances with Membranes: Breakthroughs from Super-resolution Imaging.Curr Top Membr. 2015;75:59-123. doi: 10.1016/bs.ctm.2015.03.008. Epub 2015 Apr 15. Curr Top Membr. 2015. PMID: 26015281 Free PMC article. Review.
-
Synthesis of nanostructured and biofunctionalized water-in-oil droplets as tools for homing T cells.J Am Chem Soc. 2013 Mar 6;135(9):3339-42. doi: 10.1021/ja311588c. Epub 2013 Feb 25. J Am Chem Soc. 2013. PMID: 23419177 Free PMC article.
-
LFA-1 nanoclusters integrate TCR stimulation strength to tune T-cell cytotoxic activity.Nat Commun. 2024 Jan 9;15(1):407. doi: 10.1038/s41467-024-44688-3. Nat Commun. 2024. PMID: 38195629 Free PMC article.
-
Cross-TCR Antagonism Revealed by Optogenetically Tuning the Half-Life of the TCR Ligand Binding.Int J Mol Sci. 2021 May 6;22(9):4920. doi: 10.3390/ijms22094920. Int J Mol Sci. 2021. PMID: 34066527 Free PMC article.
-
Surfing on Membrane Waves: Microvilli, Curved Membranes, and Immune Signaling.Front Immunol. 2020 Sep 11;11:2187. doi: 10.3389/fimmu.2020.02187. eCollection 2020. Front Immunol. 2020. PMID: 33013920 Free PMC article. Review.
References
-
- Monks CR, Freiberg BA, Kupfer H, Sciaky N, Kupfer A. Three-dimensional segregation of supramolecular activation clusters in T cells. Nature. 1998;395:82–86. - PubMed
-
- Grakoui A, et al. The immunological synapse: a molecular machine controlling T cell activation. Science. 1999;285:221–227. - PubMed
-
- Yokosuka T, et al. Newly generated T cell receptor microclusters initiate and sustain T cell activation by recruitment of Zap70 and SLP-76. Nat Immunol. 2005;6:1253–1262. - PubMed
Publication types
MeSH terms
Substances
Grants and funding
LinkOut - more resources
Full Text Sources
Other Literature Sources
Research Materials
