

NF-kappaB signaling mediates the induction of MTA1 by hepatitis B virus transactivator protein HBx
- PMID: 20010875
- PMCID: PMC3621706
- DOI: 10.1038/onc.2009.404
NF-kappaB signaling mediates the induction of MTA1 by hepatitis B virus transactivator protein HBx
Abstract
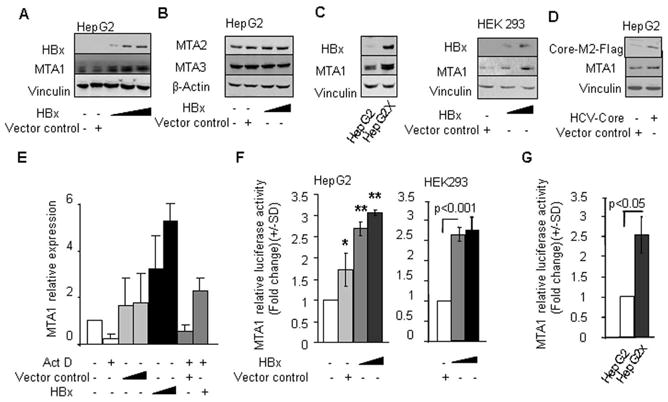
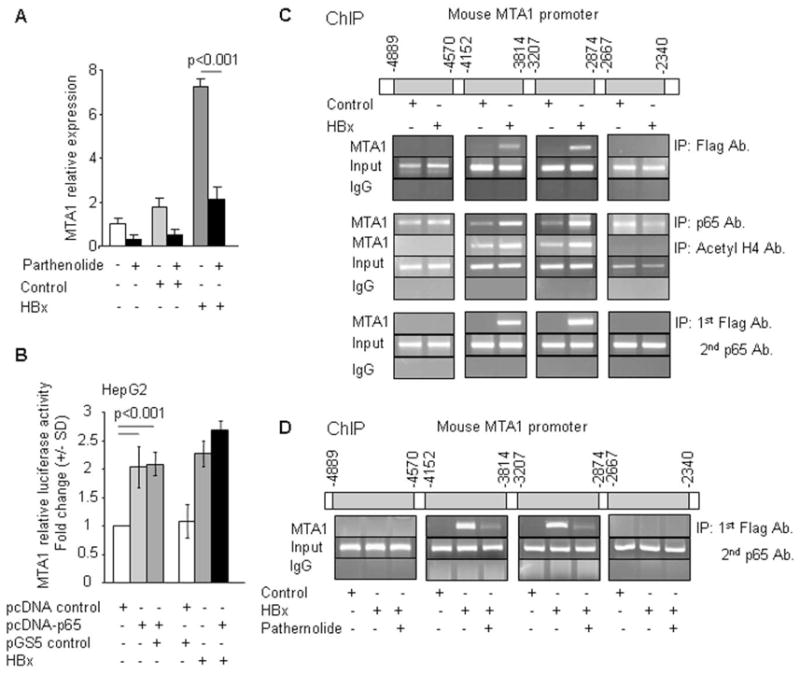
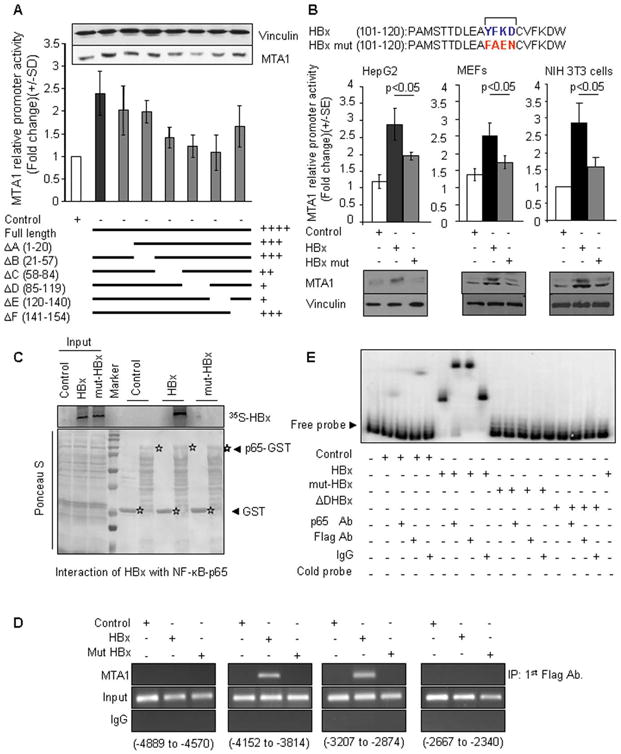
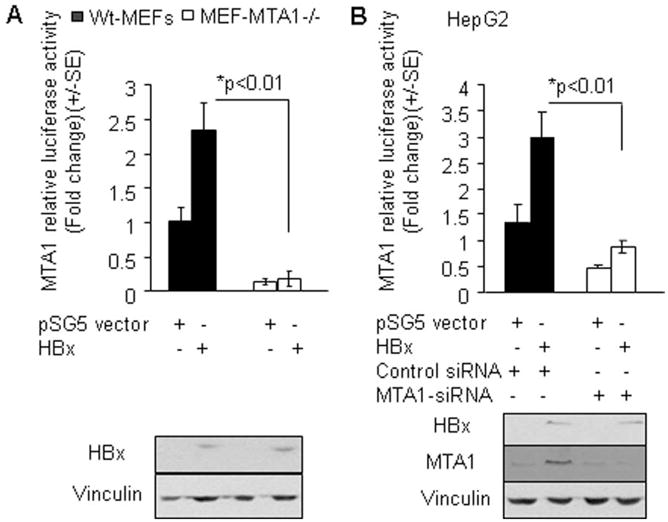
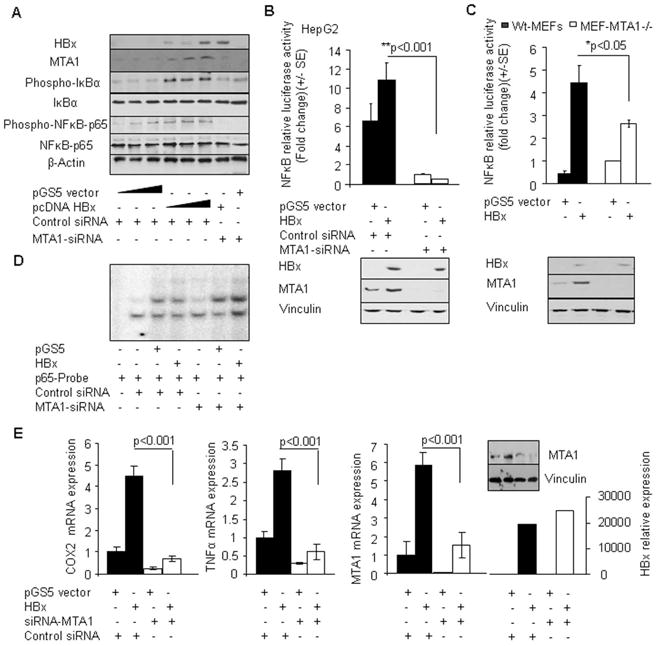
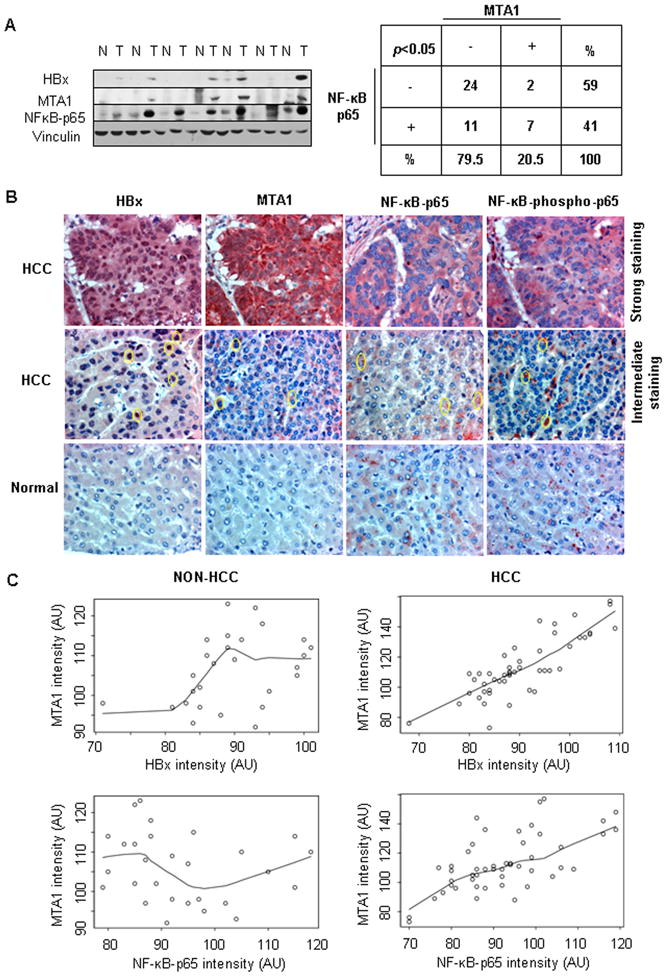
Metastasis-associated protein 1 (MTA1), a master chromatin modifier, has been shown to regulate cancer progression and is widely upregulated in human cancer, including hepatitis B virus-associated hepatocellular carcinomas (HCCs). Here we provide evidence that hepatitis B virus transactivator protein HBx stimulates the expression of MTA1 but not of MTA2 or MTA3. The underlying mechanism of HBx stimulation of MTA1 involves HBx targeting of transcription factor nuclear factor (NF)-kappaB and the recruitment of HBx/p65 complex to the NF-kappaB consensus motif on the relaxed MTA1 gene chromatin. We also discovered that MTA1 depletion in HBx-expressing cells severely impairs the ability of HBx to stimulate NF-kappaB signaling and the expression of target proinflammatory molecules. Furthermore, the presence of HBx in HBx-infected HCCs correlated well with increased MTA1 and NF-kappaB-p65. Collectively, these findings revealed a previously unrecognized integral role of MTA1 in HBx stimulation of NF-kappaB signaling and consequently, the expression of NF-kappaB targets gene products with functions in inflammation and tumorigenesis.
Figures
Similar articles
-
Stimulation of inducible nitric oxide by hepatitis B virus transactivator protein HBx requires MTA1 coregulator.J Biol Chem. 2010 Mar 5;285(10):6980-6. doi: 10.1074/jbc.M109.065987. Epub 2009 Dec 18. J Biol Chem. 2010. Retraction in: J Biol Chem. 2017 Mar 17;292(11):4765. doi: 10.1074/jbc.A117.065987. PMID: 20022949 Free PMC article. Retracted.
-
Hepatitis B virus HBx protein activates transcription factor NF-kappaB by acting on multiple cytoplasmic inhibitors of rel-related proteins.J Virol. 1996 Jul;70(7):4558-66. doi: 10.1128/JVI.70.7.4558-4566.1996. J Virol. 1996. PMID: 8676482 Free PMC article.
-
The hepatitis B virus X protein induces HIV-1 replication and transcription in synergy with T-cell activation signals: functional roles of NF-kappaB/NF-AT and SP1-binding sites in the HIV-1 long terminal repeat promoter.J Biol Chem. 2001 Sep 21;276(38):35435-43. doi: 10.1074/jbc.M103020200. Epub 2001 Jul 16. J Biol Chem. 2001. PMID: 11457829
-
The role of the MTA family and their encoded proteins in human cancers: molecular functions and clinical implications.Clin Exp Metastasis. 2009;26(3):215-27. doi: 10.1007/s10585-008-9233-8. Epub 2008 Dec 31. Clin Exp Metastasis. 2009. PMID: 19116762 Review.
-
Tumor metastasis-associated human MTA1 gene and its MTA1 protein product: role in epithelial cancer cell invasion, proliferation and nuclear regulation.Clin Exp Metastasis. 2003;20(1):19-24. doi: 10.1023/a:1022534217769. Clin Exp Metastasis. 2003. PMID: 12650603 Review.
Cited by
-
Development and validation of prognostic dynamic nomograms for hepatitis B Virus-related hepatocellular carcinoma with microvascular invasion after curative resection.Front Oncol. 2023 Apr 19;13:1166327. doi: 10.3389/fonc.2023.1166327. eCollection 2023. Front Oncol. 2023. PMID: 37152055 Free PMC article.
-
Role of hsa‑miR‑105 during the pathogenesis of paclitaxel resistance and its clinical implication in ovarian cancer.Oncol Rep. 2021 May;45(5):84. doi: 10.3892/or.2021.8035. Epub 2021 Apr 13. Oncol Rep. 2021. PMID: 33846814 Free PMC article.
-
Elevated MTA1 induced the migration and invasion of renal cell carcinoma through the NF-κB pathway.BMC Urol. 2020 Oct 15;20(1):160. doi: 10.1186/s12894-020-00731-1. BMC Urol. 2020. PMID: 33059651 Free PMC article.
-
Dynamic expression of ZNF382 and its tumor-suppressor role in hepatitis B virus-related hepatocellular carcinogenesis.Oncogene. 2019 Jun;38(24):4804-4819. doi: 10.1038/s41388-019-0759-9. Epub 2019 Feb 25. Oncogene. 2019. PMID: 30804458
-
MTA1 coregulation of transglutaminase 2 expression and function during inflammatory response.J Biol Chem. 2011 Mar 4;286(9):7132-8. doi: 10.1074/jbc.M110.199273. Epub 2010 Dec 14. J Biol Chem. 2011. PMID: 21156794 Free PMC article.
References
-
- Anderson P, Kedersha N. Mol Cell. 2007;25:796–7. - PubMed
-
- Bagheri-Yarmand R, Talukder AH, Wang RA, Vadlamudi RK, Kumar R. Development. 2004;131:3469–79. - PubMed
-
- Bergametti F, Prigent S, Luber B, Benoit A, Tiollais P, Sarasin A, Transy C. Oncogene. 1999;18:2860–71. - PubMed
-
- Chen CJ, Yang HI, Su J, Jen CL, You SL, Lu SN, Huang GT, Iloeje UH. JAMA. 2006;295:65–73. - PubMed
Publication types
MeSH terms
Substances
Grants and funding
LinkOut - more resources
Full Text Sources
Research Materials
Miscellaneous
