. 2010 Mar;18(3):561-9.
doi: 10.1038/mt.2009.281. Epub 2009 Dec 15.

The use of inhibitors to study endocytic pathways of gene carriers: optimization and pitfalls

Affiliations

The use of inhibitors to study endocytic pathways of gene carriers: optimization and pitfalls

Dries Vercauteren et al. Mol Ther. 2010 Mar.

Abstract

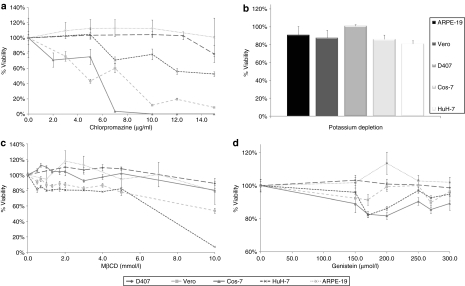
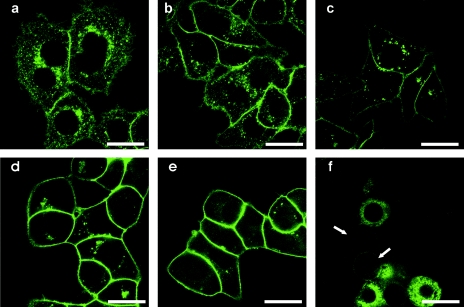
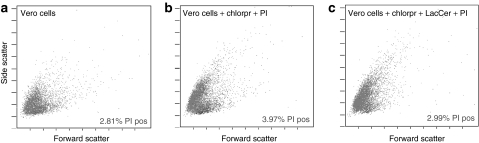
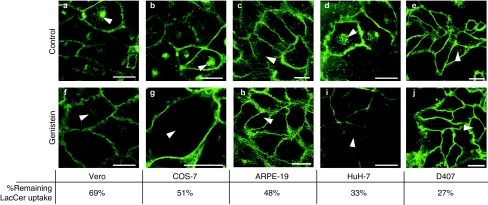
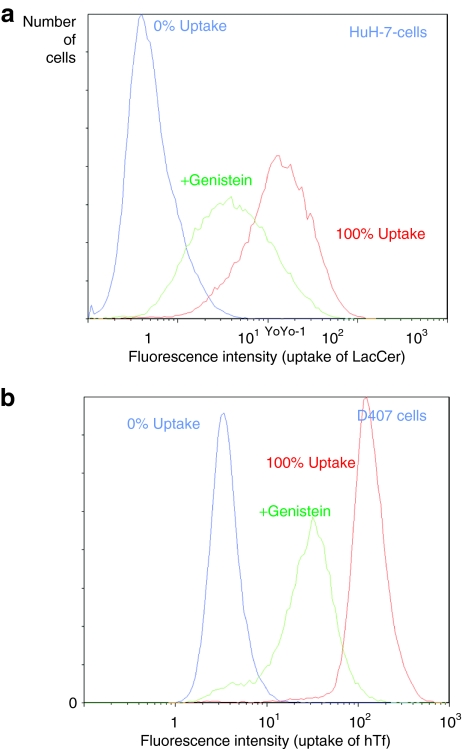
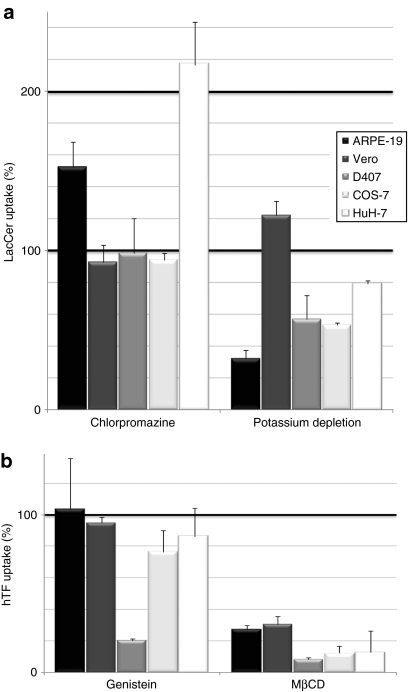
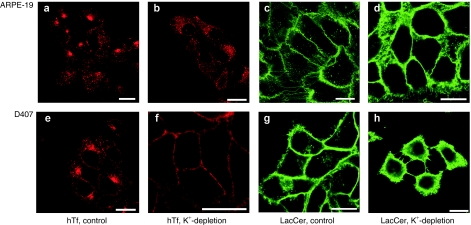
Nonviral gene complexes can enter mammalian cells through different endocytic pathways. For efficient optimization of the gene carrier it is important to profile its cellular uptake, because this largely determines its intracellular processing and subsequent transfection efficiency. Most of the current information on uptake of these gene-delivery vehicles is based on data following the use of chemical inhibitors of endocytic pathways. Here, we have performed a detailed characterization of four commonly used endocytosis inhibitors [chlorpromazine, genistein, methyl-beta-cyclodextrin (MbetaCD), and potassium depletion] on cell viability and endocytosis in five well-described cell lines. We found that chlorpromazine and to a lesser extent MbetaCD significantly decreased cell viability of some cell lines even after short incubation periods and at concentrations that are routinely used to inhibit endocytosis. Through analyzing the uptake and subcellular distribution of two fluorescent endocytic probes transferrin and lactosylceramide (LacCer) that are reported to enter cells via clathrin-dependent (CDE) and clathrin-independent (CIE) mechanisms, respectively, we showed poor specificity of these agents for inhibiting distinct endocytic pathways. Finally, we demonstrate that any inhibitory effects are highly cell line dependent. Overall, the data question the significance of performing endocytosis studies with these agents in the absence of very stringent controls.


Figures

<b>Figure 1</b>
Figure 1
In vitro cytotoxicity of inhibitors. In vitro viability of D407, Vero, COS-7, HuH-7, and ARPE-19 cells incubated for 2 hours with endocytosis inhibitors (a) chlorpromazine, (b) K+-depletion buffer, (c) MβCD, and (d) genistein. Cell viability was assessed with an MTT-based assay. Values are given as means + SD of quadruplicates. MβCD, methyl-β-cyclodextrin.
<b>Figure 2</b>
Figure 2
Optimization of the concentration of MβCD to inhibit CIE in D407 cells. Optimization of the concentration of MβCD to inhibit CIE in D407 cells. Cells were incubated with LacCer following preincubation with increasing concentrations of MβCD for different incubation times. (a) Positive control, (b) 30 minutes 2.5 mmol/l MβCD, (c) 1 hour 2.5 mmol/l MβCD, (d) 2 hours 3 mmol/l MβCD, (e) 2 hours 5 mmol/l MβCD, and (f) 2 hours 10 mmol/l MβCD. The presence of fluorescently labeled vesicles in the interior of the cell is a measure of endocytic uptake of LacCer. Arrows are pointing out cells which suffered the MβCD treatment, resulting in rounding up and lifting of the cells from the growth surface. All experiments were performed at least three times and representative images are shown. Bars = 20 µm. CIE, clathrin-independent endocytosis; LacCer, lactosylceramide; MβCD, methyl-β-cyclodextrin.
<b>Figure 3</b>
Figure 3
Effect of chlorpromazine on morphology of Vero cells. The diagram shows side and forward scattering histograms for Vero cells as measured by flow cytometry. In the scatterplots, each spot represents a cell and the x- and y-values are related with size (forward scatter) and granularity (side scatter). Scatterplot of (a) normal untreated Vero cells, (b) Vero cells treated for 2 hours with 10 µg/ml chlorpromazine and stained for dead cells with PI, (c) Vero cells treated with chlorpromazine and incubated with LacCer and back exchanged with defatted BSA before PI staining. The percentage of PI positive cells is shown in the right lower corner of the diagrams. BSA, bovine serum albumin; chlorpr, chlorpromazine; LacCer, lactosylceramide; PI, propidium iodide.
<b>Figure 4</b>
Figure 4
Efficacy of endocytosis inhibitors. Quantification of (a) hTF and (b) LacCer uptake by flow cytometry in ARPE-19, Vero, D407, COS-7, and HuH-7 cells after incubation with (a) chlorpromazine or potassium depletion buffer and (b) genistein or MβCD. Values are given as means + SD of triplicates. hTF, human transferrin; LacCer, lactosylceramide; MβCD, methyl-β-cyclodextrin.
<b>Figure 5</b>
Figure 5
Intracellular distribution of LacCer after genistein treatment is dependent on cell type. Evaluation of LacCer uptake in (a,f) Vero, (b,g) COS-7, (c,h) ARPE-19, (d,i) HuH-7, and (e,j) D407 cells in the absence and presence of genistein. a–e, Control, f–j are the corresponding cell lines incubated with 400 µmol/l genistein for 2 hours. The amount of intracellular stained vesicles is a measure for the remaining uptake of LacCer (arrowheads). The percentage of remaining LacCer uptake shown at the bottom of the figure are the corresponding values obtained by flow cytometry. All experiments were performed at least three times and representative images are shown. Bars = 20 µm. LacCer, lactosylceramide.
<b>Figure 6</b>
Figure 6
Distribution of fluorescence values after marker uptake as obtained with FC. (a) Fluorescence intensity histograms of HuH-7 cells incubated with LacCer at 4 °C (blue; “0% uptake”), at 37 °C (red; “100% uptake”), and cells incubated with 400 µmol/l genistein for 2 hours before LacCer addition (green; “+genistein”). (b) Fluorescence intensity histograms of D407 cells incubated with hTF at 4 °C (blue; “0% uptake”), at 37 °C (red; “100% uptake”), and cells incubated with 400 µmol/l genistein for 2 hours before hTf addition (green; “+genistein”). FC, flow cytometry; hTF, human transferrin; LacCer, lactosylceramide.
<b>Figure 7</b>
Figure 7
Specificity of endocytosis inhibitors. Quantification of (a) LacCer and (b) hTf uptake by flow cytometry in ARPE-19, Vero, RPE (D407), COS-7, and HuH-7 cells after incubation with (a) chlorpromazine or potassium depletion buffer and (b) genistein and MβCD. Values are given as means + SD of triplicates. hTF, human transferrin; LacCer, lactosylceramide; MβCD, methyl-β-cyclodextrin; RPE, retinal pigment epithelium.
<b>Figure 8</b>
Figure 8
Intracellular distribution of endocytic markers after K+-depletion in RPE cells. Evaluation by confocal microscopy of hTF (red) and LacCer (green) uptake in (a–d) ARPE-19 and (e–h) D407 cells. (a,e) Control samples following incubation with hTf uptake, or (c,g) LacCer. b,f,d, and h are the corresponding cell lines following K+-depletion. All experiments were performed at least three times and representative images are shown. Bars = 20 µm. hTF, human transferrin; LacCer, lactosylceramide; RPE, retinal pigment epithelium.

References

    1. Wattiaux R, Laurent N, Wattiaux-De Coninck S., and , Jadot M. Endosomes, lysosomes: their implication in gene transfer. Adv Drug Deliv Rev. 2000;41:201–208. - PubMed
    1. Conner SD., and , Schmid SL. Regulated portals of entry into the cell. Nature. 2003;422:37–44. - PubMed
    1. Jones AT. Macropinocytosis: searching for an endocytic identity and role in the uptake of cell penetrating peptides. J Cell Mol Med. 2007;11:670–684. - PMC - PubMed
    1. Grimmer S, van Deurs B., and , Sandvig K. Membrane ruffling and macropinocytosis in A431 cells require cholesterol. J Cell Sci. 2002;115 Pt 14:2953–2962. - PubMed
    1. Rejman J, Oberle V, Zuhorn IS., and , Hoekstra D. Size-dependent internalization of particles via the pathways of clathrin- and caveolae-mediated endocytosis. Biochem J. 2004;377 Pt 1:159–169. - PMC - PubMed

Publication types

LinkOut - more resources