

Cisplatin-induced expression of Gb3 enables verotoxin-1 treatment of cisplatin resistance in malignant pleural mesothelioma cells
- PMID: 20010943
- PMCID: PMC2816648
- DOI: 10.1038/sj.bjc.6605467
Cisplatin-induced expression of Gb3 enables verotoxin-1 treatment of cisplatin resistance in malignant pleural mesothelioma cells
Abstract
Background: A major problem with cisplatin treatment is the development of acquired-drug resistance of the tumour cells. Verotoxin-1 (VT-1) exerts its cytotoxicity by targeting the membrane glycolipid globotriasosylceramide (Gb3), a molecule associated with drug resistance. Cisplatin- and VT-1-induced apoptosis involves mitogen-activated protein kinase (MAPK) activation, and deactivation of MAPKs is associated with cisplatin resistance. This study aimed to investigate whether a sub-toxic concentration of VT-1 could enhance cisplatin-induced apoptosis and overcome acquired-cisplatin resistance in cultured cancer cell lines.
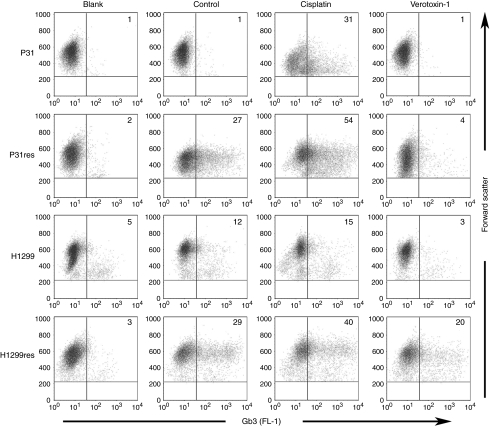
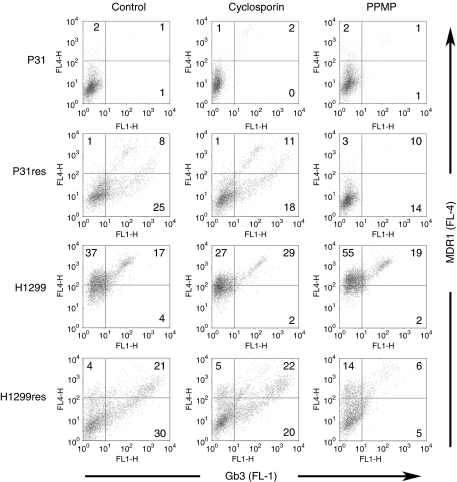
Method: P31 and H1299 cells with corresponding cisplatin-resistant sub-lines (P31res/H1299res) were incubated with VT-1 and/or cisplatin followed by determination of Gb3 expression, cell viability, apoptosis, and signalling pathways.
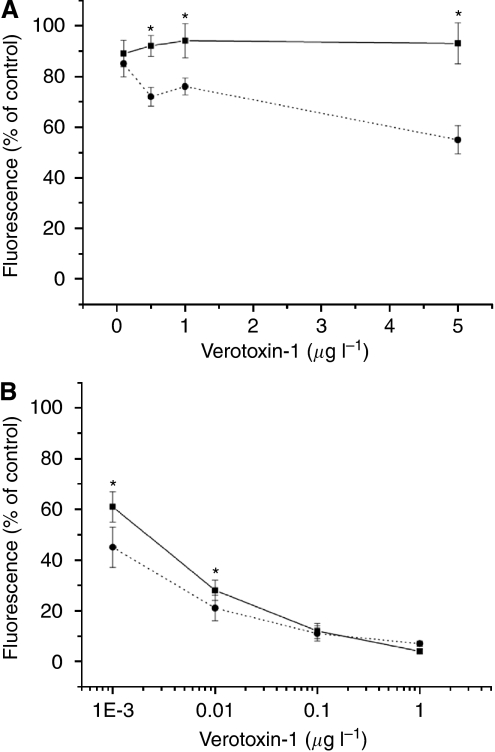
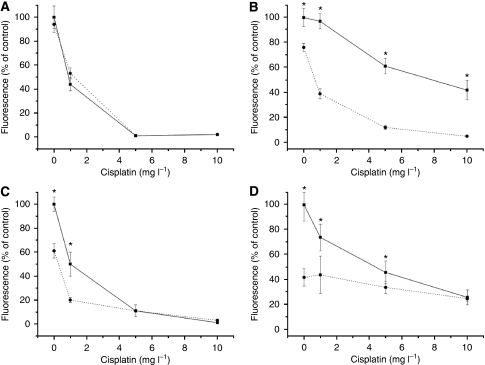
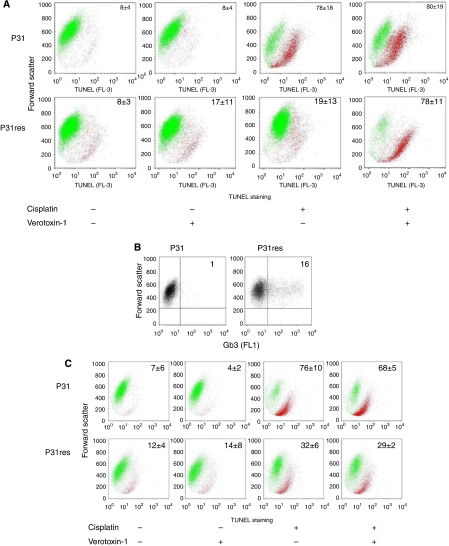
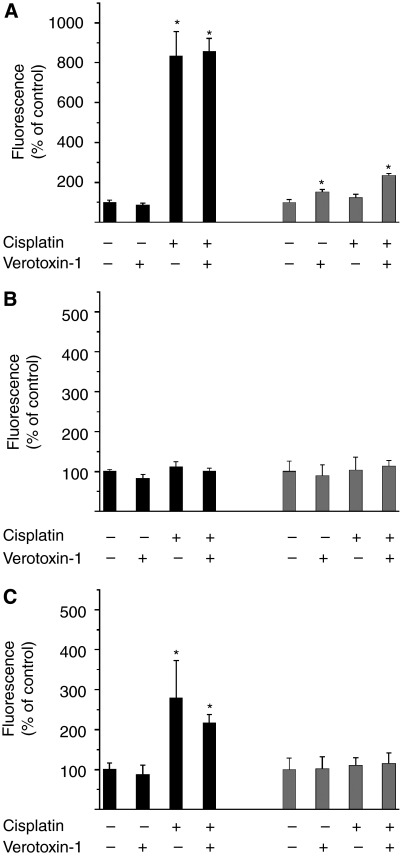
Results: Cells from the resistant sub-lines had elevated Gb3 expression compared with the parental cell lines, and cisplatin further increased Gb3 expression, whereas VT-1 reduced the percentage of Gb3-expressing cells. Combination of cisplatin and sub-toxic concentrations of VT-1 led to a super-additive increase of cytotoxicity and TUNEL staining, especially in the cisplatin-resistant sub-lines. Blockade of Gb3 synthesis by a Gb3 synthesis inhibitor not only led to eradicated TUNEL staining of P31 cells, but also sensitised P31res cells to the induction of apoptosis by cisplatin alone. Cisplatin- and VT-1-induced apoptosis involved the MAPK pathways with increased C-Jun N-terminal kinase and MAPK kinase-3 and -6 phosphorylation.
Conclusions: We show the presence of Gb3 in acquired-cisplatin resistance in P31res and H1299res cells. Cisplatin up-regulated Gb3 expression in all cells and thus sensitised the cells to VT-1-induced cytotoxicity. A strong super-additive effect of combined cisplatin and a sub-toxic concentration of VT-1 in cisplatin-resistant malignant pleural mesothelioma cells were observed, indicating a new potential clinical-treatment approach.
Figures
Similar articles
-
Verotoxin-1 treatment or manipulation of its receptor globotriaosylceramide (gb3) for reversal of multidrug resistance to cancer chemotherapy.Toxins (Basel). 2010 Oct;2(10):2467-77. doi: 10.3390/toxins2102467. Epub 2010 Oct 25. Toxins (Basel). 2010. PMID: 22069561 Free PMC article. Review.
-
Targeting glucosylceramide synthase induction of cell surface globotriaosylceramide (Gb3) in acquired cisplatin-resistance of lung cancer and malignant pleural mesothelioma cells.Exp Cell Res. 2015 Aug 1;336(1):23-32. doi: 10.1016/j.yexcr.2015.05.012. Epub 2015 May 22. Exp Cell Res. 2015. PMID: 26004871
-
Verotoxin-1 induction of apoptosis in Gb3-expressing human glioma cell lines.Cancer Biol Ther. 2006 Sep;5(9):1211-7. doi: 10.4161/cbt.5.9.3173. Epub 2006 Sep 10. Cancer Biol Ther. 2006. PMID: 16929170
-
alpha-Toxin of Staphylococcus aureus overcomes acquired cisplatin-resistance in malignant mesothelioma cells.Cancer Lett. 2008 Jun 28;265(1):67-75. doi: 10.1016/j.canlet.2008.02.007. Epub 2008 Mar 24. Cancer Lett. 2008. PMID: 18362050
-
Verotoxin/globotriaosyl ceramide recognition: angiopathy, angiogenesis and antineoplasia.Biosci Rep. 1999 Oct;19(5):345-54. doi: 10.1023/a:1020299819637. Biosci Rep. 1999. PMID: 10763802 Review.
Cited by
-
Verotoxin-1 treatment or manipulation of its receptor globotriaosylceramide (gb3) for reversal of multidrug resistance to cancer chemotherapy.Toxins (Basel). 2010 Oct;2(10):2467-77. doi: 10.3390/toxins2102467. Epub 2010 Oct 25. Toxins (Basel). 2010. PMID: 22069561 Free PMC article. Review.
-
Human breast cancer and lymph node metastases express Gb3 and can be targeted by STxB-vectorized chemotherapeutic compounds.BMC Cancer. 2014 Dec 4;14:916. doi: 10.1186/1471-2407-14-916. BMC Cancer. 2014. PMID: 25476116 Free PMC article.
-
Up-regulation of sonic hedgehog contributes to TGF-β1-induced epithelial to mesenchymal transition in NSCLC cells.PLoS One. 2011 Jan 13;6(1):e16068. doi: 10.1371/journal.pone.0016068. PLoS One. 2011. Retraction in: PLoS One. 2018 Oct 2;13(10):e0205290. doi: 10.1371/journal.pone.0205290. PMID: 21249152 Free PMC article. Retracted.
-
Role of Globotriaosylceramide in Physiology and Pathology.Front Mol Biosci. 2022 Feb 23;9:813637. doi: 10.3389/fmolb.2022.813637. eCollection 2022. Front Mol Biosci. 2022. PMID: 35372499 Free PMC article. Review.
-
Bioenergetics of acquired cisplatin resistant H1299 non-small cell lung cancer and P31 mesothelioma cells.Oncotarget. 2017 Oct 16;8(55):94711-94725. doi: 10.18632/oncotarget.21885. eCollection 2017 Nov 7. Oncotarget. 2017. PMID: 29212260 Free PMC article.
References
-
- Andrews PA, Howell SB (1990) Cellular pharmacology of cisplatin: perspectives on mechanisms of acquired resistance. Cancer Cells 2: 35–43 - PubMed
-
- Arab S, Rutka J, Lingwood C (1999) Verotoxin induces apoptosis and the complete, rapid, long-term elimination of human astrocytoma xenografts in nude mice. Oncol Res 11: 33–39 - PubMed
-
- Brognard J, Clark AS, Ni Y, Dennis PA (2001) Akt/protein kinase B is constitutively active in non-small cell lung cancer cells and promotes cellular survival and resistance to chemotherapy and radiation. Cancer Res 61: 3986–3997 - PubMed
-
- Brozovic A, Osmak M (2007) Activation of mitogen-activated protein kinases by cisplatin and their role in cisplatin-resistance. Cancer Lett 251: 1–16 - PubMed
-
- Cvijic ME, Yang WL, Chin KV (1998) Cisplatin sensitivity in cAMP-dependent protein kinase mutants of Saccharomyces cerevisiae. Anticancer Res 18: 3187–3192 - PubMed
Publication types
MeSH terms
Substances
LinkOut - more resources
Full Text Sources
Medical
Research Materials
Miscellaneous
