

Detection of EBV infection and gene expression in oral cancer from patients in Taiwan by microarray analysis
- PMID: 20011069
- PMCID: PMC2789579
- DOI: 10.1155/2009/904589
Detection of EBV infection and gene expression in oral cancer from patients in Taiwan by microarray analysis
Abstract
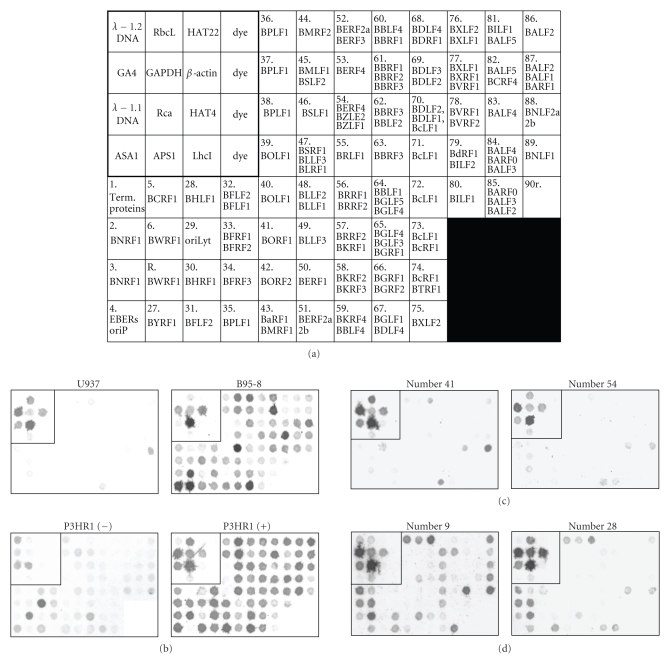
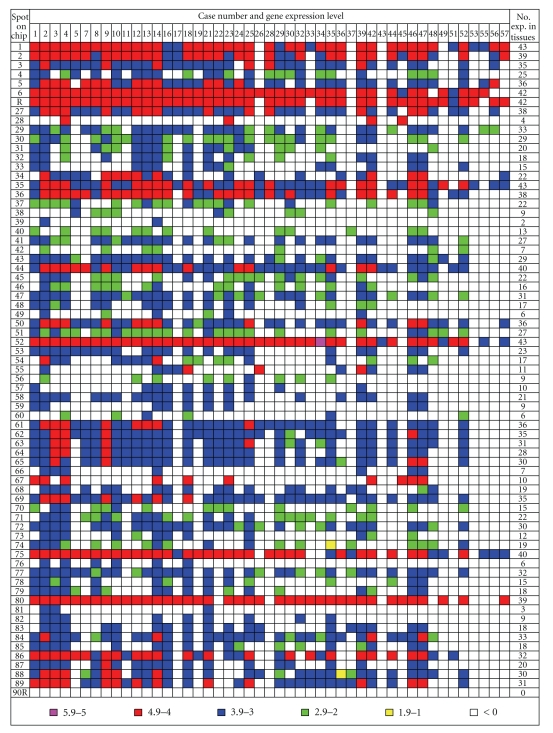
Epstein-Barr virus is known to cause nasopharyngeal carcinoma. Although oral cavity is located close to the nasal pharynx, the pathogenetic role of Epstein-Barr virus (EBV) in oral cancers is unclear. This molecular epidemiology study uses EBV genomic microarray (EBV-chip) to simultaneously detect the prevalent rate and viral gene expression patterns in 57 oral squamous cell carcinoma biopsies (OSCC) collected from patients in Taiwan. The majority of the specimens (82.5%) were EBV-positive that probably expressed coincidently the genes for EBNAs, LMP2A and 2B, and certain structural proteins. Importantly, the genes fabricated at the spots 61 (BBRF1, BBRF2, and BBRF3) and 68 (BDLF4 and BDRF1) on EBV-chip were actively expressed in a significantly greater number of OSCC exhibiting exophytic morphology or ulceration than those tissues with deep invasive lesions (P = .0265 and .0141, resp.). The results may thus provide the lead information for understanding the role of EBV in oral cancer pathogenesis.
Figures
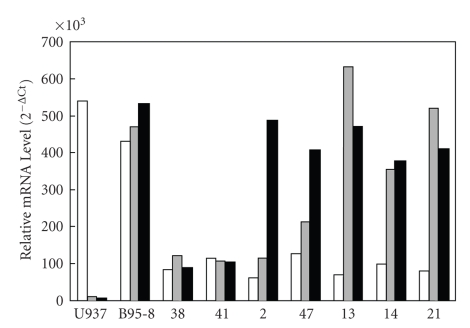
 : EBNA1; ■: EBNA2.
Similar articles
-
Epstein-Barr virus (EBV) subtype in EBV related oral squamous cell carcinoma in Okinawa, a subtropical island in southern Japan, compared with Kitakyushu and Kumamoto in mainland Japan.J Clin Pathol. 2002 Jun;55(6):414-23. doi: 10.1136/jcp.55.6.414. J Clin Pathol. 2002. PMID: 12037022 Free PMC article.
-
Association of Epstein-Barr virus infection with oral squamous cell carcinoma in a case-control study.J Oral Pathol Med. 2015 Apr;44(4):252-7. doi: 10.1111/jop.12231. Epub 2014 Aug 28. J Oral Pathol Med. 2015. PMID: 25169715
-
Epstein-Barr virus prevalence in oral squamous cell cancer and in potentially malignant oral disorders in an eastern Hungarian population.Eur J Oral Sci. 2009 Oct;117(5):536-40. doi: 10.1111/j.1600-0722.2009.00660.x. Eur J Oral Sci. 2009. PMID: 19758249
-
Pathogenic roles for Epstein-Barr virus (EBV) gene products in EBV-associated proliferative disorders.Crit Rev Oncol Hematol. 2003 Jan;45(1):1-36. doi: 10.1016/s1040-8428(02)00078-1. Crit Rev Oncol Hematol. 2003. PMID: 12482570 Review.
-
Epstein-Barr Virus Strain Variation.Curr Top Microbiol Immunol. 2015;390(Pt 1):45-69. doi: 10.1007/978-3-319-22822-8_4. Curr Top Microbiol Immunol. 2015. PMID: 26424643 Review.
Cited by
-
Association of human papillomavirus and Epstein-Barr virus with squamous cell carcinoma of upper aerodigestive tract.Natl J Maxillofac Surg. 2022 Sep-Dec;13(3):367-375. doi: 10.4103/njms.njms_315_21. Epub 2022 Dec 10. Natl J Maxillofac Surg. 2022. PMID: 36683943 Free PMC article.
-
Evidences suggesting involvement of viruses in oral squamous cell carcinoma.Patholog Res Int. 2013;2013:642496. doi: 10.1155/2013/642496. Epub 2013 Dec 19. Patholog Res Int. 2013. PMID: 24455418 Free PMC article. Review.
-
The Oncogenic Role of VWA8-AS1, a Long Non-Coding RNA, in Epstein-Barr Virus-Associated Oral Squamous Cell Carcinoma: An Integrative Transcriptome and Functional Analysis.Int J Mol Sci. 2024 Nov 22;25(23):12565. doi: 10.3390/ijms252312565. Int J Mol Sci. 2024. PMID: 39684278 Free PMC article.
-
Role of viruses in oral squamous cell carcinoma.Oncol Rev. 2012 Sep 14;6(2):e21. doi: 10.4081/oncol.2012.e21. eCollection 2012 Oct 2. Oncol Rev. 2012. PMID: 25992219 Free PMC article. Review.
-
The World of Oral Cancer and Its Risk Factors Viewed from the Aspect of MicroRNA Expression Patterns.Genes (Basel). 2022 Mar 26;13(4):594. doi: 10.3390/genes13040594. Genes (Basel). 2022. PMID: 35456400 Free PMC article. Review.
References
-
- Chen YK, Huang HC, Lin LM, Lin CC. Primary oral squamous cell carcinomaFan analysis of 703 cases in southern Taiwan. Oral Oncology. 1999;35(2):173–179. - PubMed
-
- Liao C-T, Chang JT-C, Wang H-M, et al. Analysis of risk factors of predictive local tumor control in oral cavity cancer. Annals of Surgical Oncology. 2008;15(3):915–922. - PubMed
-
- Raab-Traub N. Epstein-Barr virus in the pathogenesis of NPC. Seminars in Cancer Biology. 2002;12(6):431–441. - PubMed
-
- Wang C-C, Chen M-L, Hsu K-H, et al. Second malignant tumors in patients with nasopharyngeal carcinoma and their association with Epstein-Barr virus. International Journal of Cancer. 2000;87(2):228–231. - PubMed
-
- Young LS, Rickinson AB. Epstein-Barr virus: 40 years on. Nature Reviews Cancer. 2004;4(10):757–768. - PubMed
Publication types
MeSH terms
Substances
LinkOut - more resources
Full Text Sources
Other Literature Sources
Medical