Meta-Analysis
. 2009 Dec;5(12):e1000593.
doi: 10.1371/journal.pcbi.1000593. Epub 2009 Dec 11.

The GAAS metagenomic tool and its estimations of viral and microbial average genome size in four major biomes

Affiliations
Meta-Analysis

The GAAS metagenomic tool and its estimations of viral and microbial average genome size in four major biomes

Florent E Angly et al. PLoS Comput Biol. 2009 Dec.

Abstract

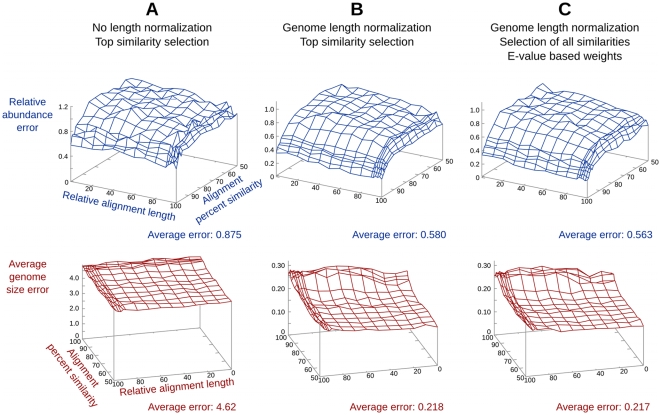
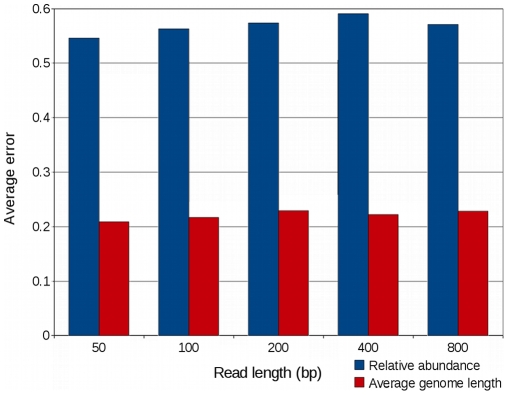
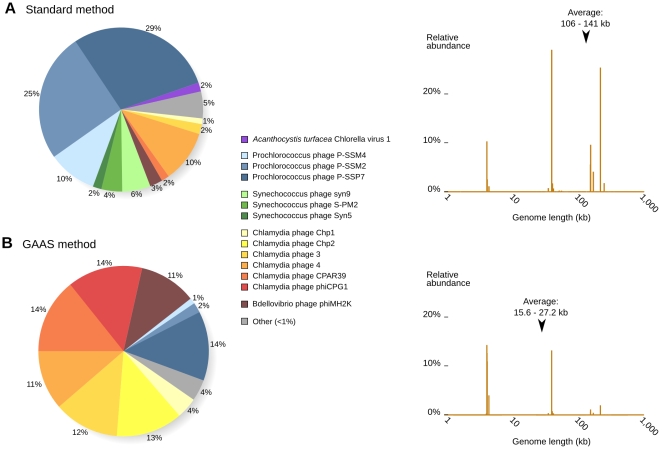
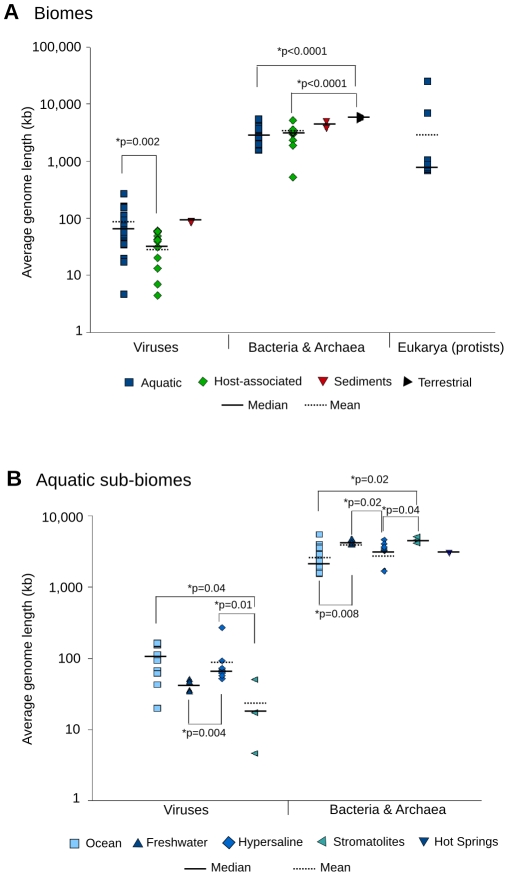
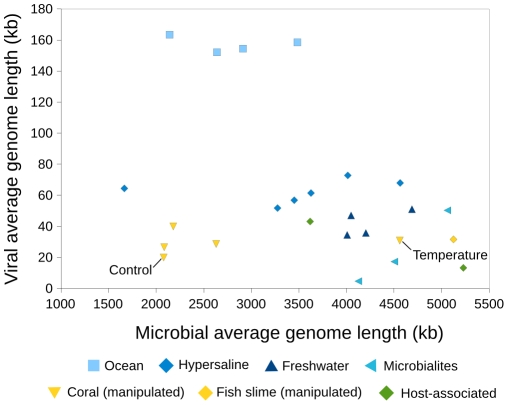
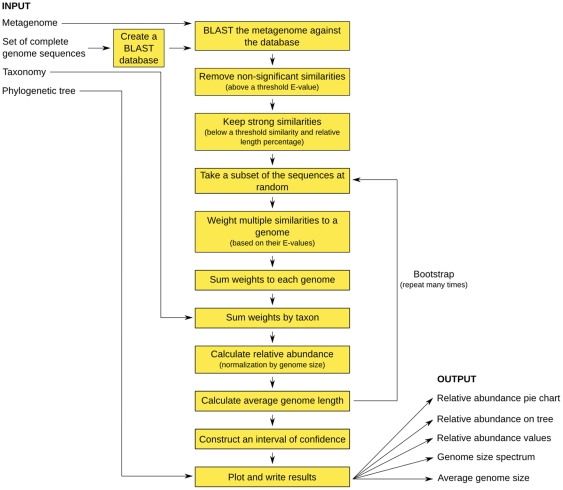
Metagenomic studies characterize both the composition and diversity of uncultured viral and microbial communities. BLAST-based comparisons have typically been used for such analyses; however, sampling biases, high percentages of unknown sequences, and the use of arbitrary thresholds to find significant similarities can decrease the accuracy and validity of estimates. Here, we present Genome relative Abundance and Average Size (GAAS), a complete software package that provides improved estimates of community composition and average genome length for metagenomes in both textual and graphical formats. GAAS implements a novel methodology to control for sampling bias via length normalization, to adjust for multiple BLAST similarities by similarity weighting, and to select significant similarities using relative alignment lengths. In benchmark tests, the GAAS method was robust to both high percentages of unknown sequences and to variations in metagenomic sequence read lengths. Re-analysis of the Sargasso Sea virome using GAAS indicated that standard methodologies for metagenomic analysis may dramatically underestimate the abundance and importance of organisms with small genomes in environmental systems. Using GAAS, we conducted a meta-analysis of microbial and viral average genome lengths in over 150 metagenomes from four biomes to determine whether genome lengths vary consistently between and within biomes, and between microbial and viral communities from the same environment. Significant differences between biomes and within aquatic sub-biomes (oceans, hypersaline systems, freshwater, and microbialites) suggested that average genome length is a fundamental property of environments driven by factors at the sub-biome level. The behavior of paired viral and microbial metagenomes from the same environment indicated that microbial and viral average genome sizes are independent of each other, but indicative of community responses to stressors and environmental conditions.


Conflict of interest statement

The authors have declared that no competing interests exist.

Figures

Figure 1
Figure 1. Effects of length normalization and similarity weighting on the accuracy of GAAS estimates.
Different methods were used: (A) the standard method (no length normalization, selection of the top similarity only), (B) a combination of genome length normalization and top similarity selection only, and (C) the GAAS method (genome length normalization, selection of all significant similarities, and E-value based weights). Decreases in average error indicate increased accuracy. In the simulated viral metagenomes, 100 bp sequences were used and 80% of the species were considered unknown.
Figure 2
Figure 2. Effects of metagenomic read length on average error of GAAS estimates.
Decreases in average error indicate increased accuracy. In the simulated metagenomes, 80% of the species were considered unknown. See Figure S5 and Figure S6 for full details.
Figure 3
Figure 3. Re-analysis of the Sargasso Sea viral community.
Genome relative abundance in the Sargasso Sea (left) and size spectrum with 95% confidence interval for the average genome length (right) were calculated using the standard method (A) and GAAS (B).
Figure 4
Figure 4. Average genome length of viruses, Bacteria and Archaea, and protists in metagenomes.
Different biomes (A) and marine sub-biomes (B) were analyzed using GAAS. Non-parametric Mann-Whitney U tests were used to compare biomes. Metagenomes from sediments and hot springs were excluded from the statistical analysis due their small number. All protist metagenomes were from the ocean and could not be sub-classified further.
Figure 5
Figure 5. Relationship between average microbial and viral genome lengths in paired metagenomes.
Figure 6
Figure 6. Flowchart of GAAS to calculate relative abundance and average genome size.
GAAS runs BLAST and uses various corrections to obtain accurate estimations.

Similar articles

Cited by

References

    1. Angly FE, Felts B, Breitbart M, Salamon P, Edwards RA, et al. The marine viromes of four oceanic regions. PLoS Biology. 2006;4:e368. - PMC - PubMed
    1. Pignatelli M, Aparicio G, Blanquer I, Hernández V, Moya A, et al. Metagenomics reveals our incomplete knowledge of global diversity. Bioinformatics. 2008;24:2124–2125. - PMC - PubMed
    1. Raes J, Foerstner KU, Bork P. Get the most out of your metagenome: computational analysis of environmental sequence data. Curr Opin Microbiol. 2007;10:490–498. - PubMed
    1. Huson DH, Auch AF, Qi J, Schuster SC. MEGAN analysis of metagenomic data. Genome Res. 2007;17:377–86. - PMC - PubMed
    1. Koski LB, Golding GB. The closest BLAST hit is often not the nearest neighbor. J Mol Evol. 2001;52:540–542. - PubMed

Publication types