. 2009 Dec;5(12):e1000598.
doi: 10.1371/journal.pcbi.1000598. Epub 2009 Dec 11.

An abundance of ubiquitously expressed genes revealed by tissue transcriptome sequence data

Affiliations

An abundance of ubiquitously expressed genes revealed by tissue transcriptome sequence data

Daniel Ramsköld et al. PLoS Comput Biol. 2009 Dec.

Abstract

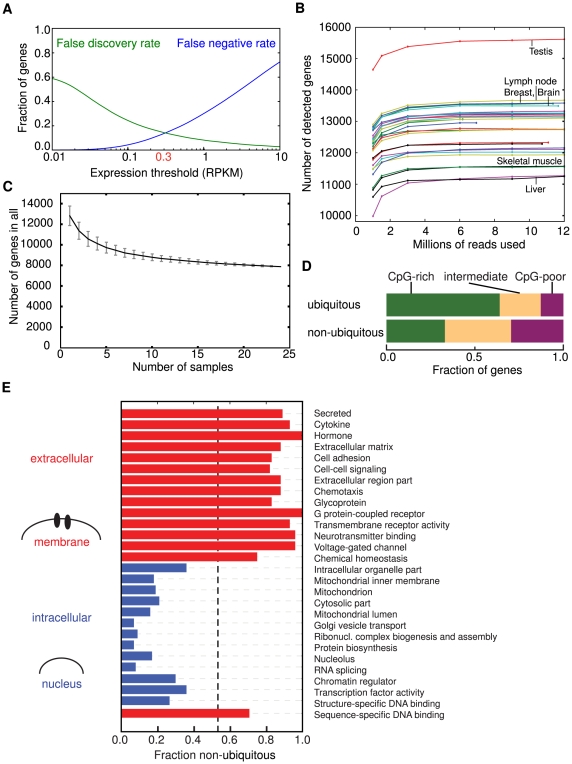
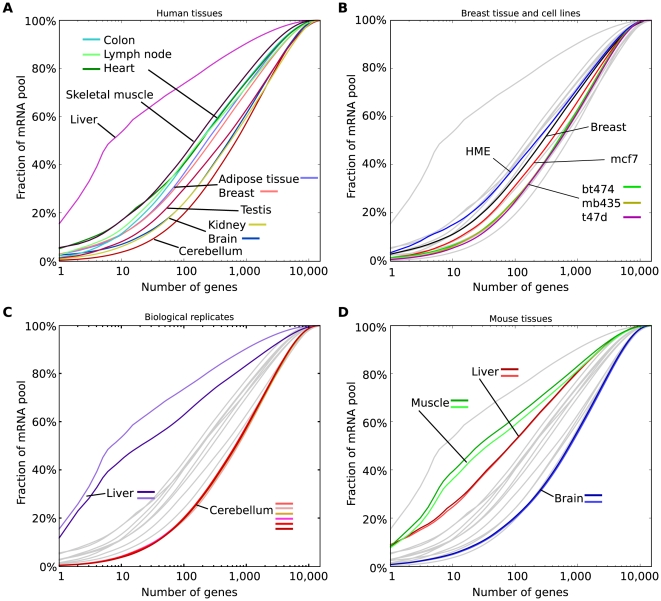
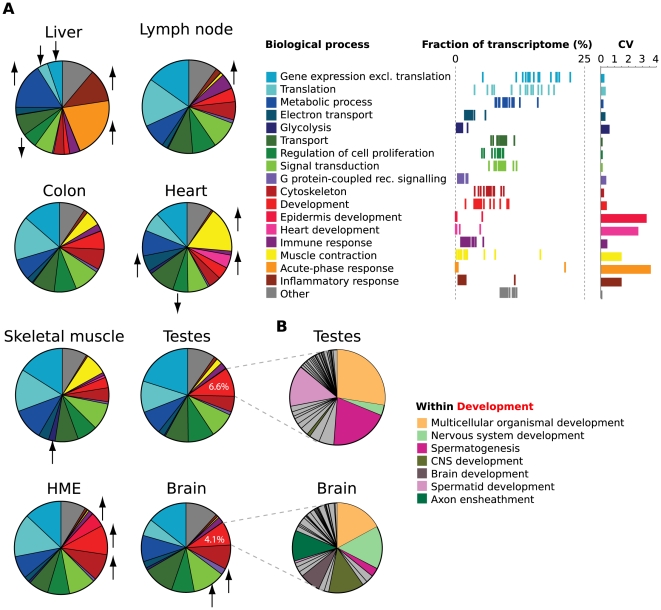
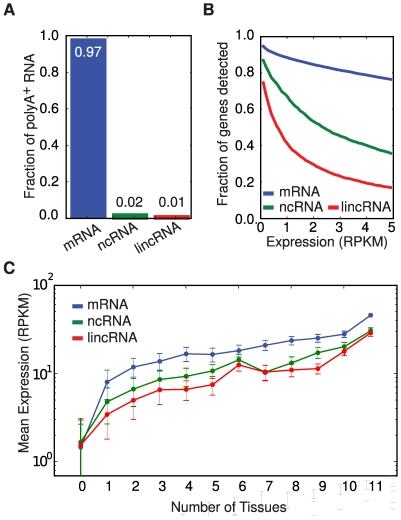
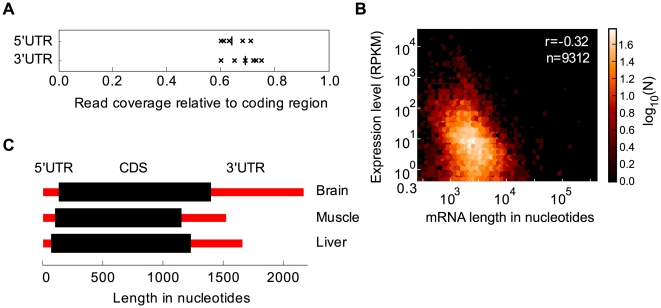
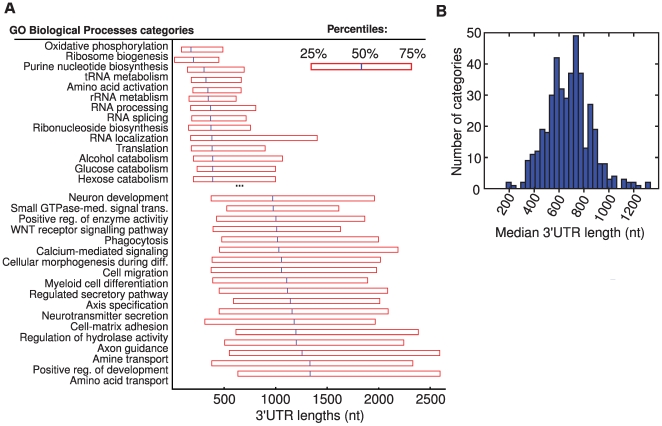
The parts of the genome transcribed by a cell or tissue reflect the biological processes and functions it carries out. We characterized the features of mammalian tissue transcriptomes at the gene level through analysis of RNA deep sequencing (RNA-Seq) data across human and mouse tissues and cell lines. We observed that roughly 8,000 protein-coding genes were ubiquitously expressed, contributing to around 75% of all mRNAs by message copy number in most tissues. These mRNAs encoded proteins that were often intracellular, and tended to be involved in metabolism, transcription, RNA processing or translation. In contrast, genes for secreted or plasma membrane proteins were generally expressed in only a subset of tissues. The distribution of expression levels was broad but fairly continuous: no support was found for the concept of distinct expression classes of genes. Expression estimates that included reads mapping to coding exons only correlated better with qRT-PCR data than estimates which also included 3' untranslated regions (UTRs). Muscle and liver had the least complex transcriptomes, in that they expressed predominantly ubiquitous genes and a large fraction of the transcripts came from a few highly expressed genes, whereas brain, kidney and testis expressed more complex transcriptomes with the vast majority of genes expressed and relatively small contributions from the most expressed genes. mRNAs expressed in brain had unusually long 3'UTRs, and mean 3'UTR length was higher for genes involved in development, morphogenesis and signal transduction, suggesting added complexity of UTR-based regulation for these genes. Our results support a model in which variable exterior components feed into a large, densely connected core composed of ubiquitously expressed intracellular proteins.


Conflict of interest statement

The authors have declared that no competing interests exist.

Figures

Figure 1
Figure 1. Functions of ubiquitous genes.
(A) False discovery and negative rate for the detection of genes as a function of detection threshold used, demonstrating how a threshold of 0.3 RPKM was chosen. (B) The number of genes detected (>0.3 RPKM) at different sequencing depths. Each curve represents a sample. Above 3 million reads the sequence depth matters little for how many genes are detected as expressed. (C) The number of ubiquitous genes (expressed >0.3 RPKM in all samples) as a function of the number of samples used. Error bars show the standard variation, black line the mean. (D) The fraction of genes among ubiquitous and other genes with CpG-poor (purple), intermediate (yellow) or CpG-rich (green) promoters. (E) Illustration of subcellular localizations aligned to protein functional and localization categories for significant categories enriched in ubiquitously expressed genes (blue) and genes that were only expressed in one or a few tissues (red). For each category we have plotted the fraction of all genes that were not ubiquitous (the overall fraction of non-ubiquitous genes are shown as a vertical dashed line). Extracellular functions and membrane functions were highly enriched for non-ubiquitous genes while intracellular functions were dominated by ubiquitous genes. The categories shown are a subset of all significant categories listed in Dataset S2 and S3.
Figure 2
Figure 2. Complexity of tissue transcriptomes.
(A) The fraction of all mRNAs derived from the most highly expressed genes for a number of mouse and human tissues. For example, the 10 most expressed genes in mouse liver contribute 25% of all mRNAs in that tissue. (B) Same as A, but with cell lines from breast. HME is a transformed cell line from normal mammary epithelium, breast is the normal tissue, the others are breast cancer cell lines from invasive ductal carcinoma. Gray lines are the tissues in A. (C) Same as B, but with 2 human livers and 6 human cerebellar samples from different individuals, to illustrate the degree of reproducibility in this type of plot and little inter-individual variation. (D) Same as B, but with three tissues from mouse.
Figure 3
Figure 3. FRACT analysis of tissue transcriptomes.
(A) Pie graphs show estimated fraction of cellular transcripts deriving from genes belonging to a set of top-level Gene Ontology Biological Process categories for 7 human tissues and 1 cell line. Fractions were estimated from read density (RPKM) of Ensembl transcripts for each gene. Names of categories, distribution of transcriptome fraction across the samples (each line is a sample), and the coefficients of variation are shown at right. Biological processes with significantly higher or lower densities in individual tissues and cell lines are denoted by arrows. (B) FRACT analysis of sub-categories of the top-level ‘Development’ category in brain and testes.
Figure 4
Figure 4. Non-coding RNA expression.
(A) Relative fractions of polyA+ transcripts from protein-coding RNA (mRNA), curated non-coding RNA (ncRNA) and lincRNA, presented as the mean across human tissues. (B) The number of genes above a particular RPKM threshold (in one or more tissues) as a function of the threshold. (C) The maximum tissue expression level of mRNAs, curated ncRNAs and lincRNAs as a function of the number of tissues with detected expression. The average and standard deviations of the max expression levels in each group of genes are shown.
Figure 5
Figure 5. Variation in tissue transcriptome structures.
(A) Read density in RefSeq gene annotation in the untranslated regions (UTRs) divided by that in the coding region (CDS) for the samples with least 3′ bias (mouse brain, muscle, embryonic stem cell and embryoid body; human adipose tissue and heart). Vertical lines indicate mean values. (B) Plot of mRNA length against abundance in mouse liver, showing that short mRNAs tend to have more copies. Pearson correlation and the number of mRNAs plotted are listed. (C) Expression-weighted average lengths of all mRNAs in three mouse tissues.
Figure 6
Figure 6. Associations between UTR lengths and protein functions.
(A) The length distribution of 3′UTRs for genes in categories with the shortest respectively longest UTRs. The 25, 50 and 75% percentile lengths for each GO biological process category are presented. (B) The distribution of median lengths across all GO biological process categories.

References

    1. Bishop JO, Morton JG, Rosbash M, Richardson M. Three abundance classes in HeLa cell messenger RNA. Nature. 1974;250:199–204. - PubMed
    1. Velculescu VE, Zhang L, Vogelstein B, Kinzler KW. Serial analysis of gene expression. Science. 1995;270:484–487. - PubMed
    1. Schena M, Shalon D, Davis RW, Brown PO. Quantitative monitoring of gene expression patterns with a complementary DNA microarray. Science. 1995;270:467–470. - PubMed
    1. Lipshutz RJ, Fodor SP, Gingeras TR, Lockhart DJ. High density synthetic oligonucleotide arrays. Nat Genetics. 1999;21:20–24. - PubMed
    1. Kawai J, Shinagawa A, Shibata K, Yoshino M, Itoh M, et al. Functional annotation of a full-length mouse cDNA collection. Nature. 2001;409:685–690. - PubMed

Publication types

Substances