. 2009 Dec;5(12):e1000605.
doi: 10.1371/journal.pcbi.1000605. Epub 2009 Dec 11.

Annotation error in public databases: misannotation of molecular function in enzyme superfamilies

Affiliations

Annotation error in public databases: misannotation of molecular function in enzyme superfamilies

Alexandra M Schnoes et al. PLoS Comput Biol. 2009 Dec.

Abstract

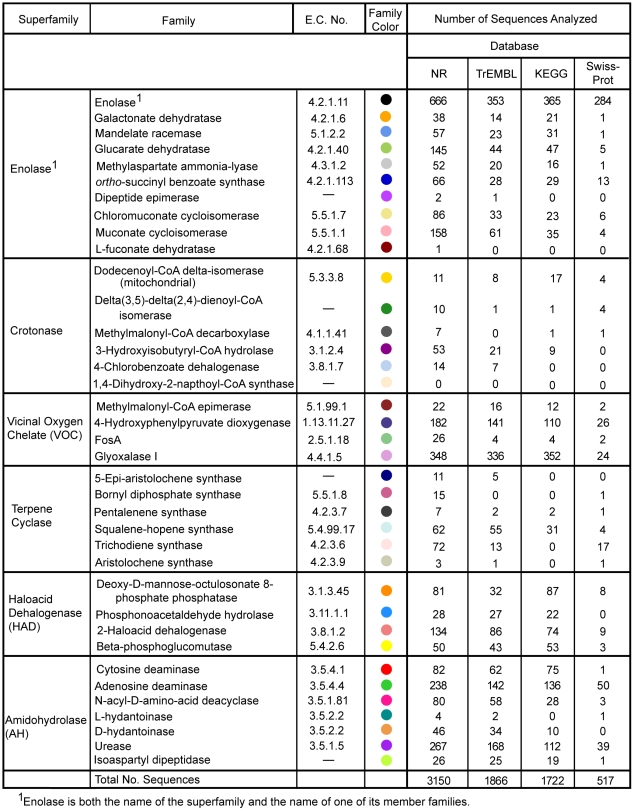
Due to the rapid release of new data from genome sequencing projects, the majority of protein sequences in public databases have not been experimentally characterized; rather, sequences are annotated using computational analysis. The level of misannotation and the types of misannotation in large public databases are currently unknown and have not been analyzed in depth. We have investigated the misannotation levels for molecular function in four public protein sequence databases (UniProtKB/Swiss-Prot, GenBank NR, UniProtKB/TrEMBL, and KEGG) for a model set of 37 enzyme families for which extensive experimental information is available. The manually curated database Swiss-Prot shows the lowest annotation error levels (close to 0% for most families); the two other protein sequence databases (GenBank NR and TrEMBL) and the protein sequences in the KEGG pathways database exhibit similar and surprisingly high levels of misannotation that average 5%-63% across the six superfamilies studied. For 10 of the 37 families examined, the level of misannotation in one or more of these databases is >80%. Examination of the NR database over time shows that misannotation has increased from 1993 to 2005. The types of misannotation that were found fall into several categories, most associated with "overprediction" of molecular function. These results suggest that misannotation in enzyme superfamilies containing multiple families that catalyze different reactions is a larger problem than has been recognized. Strategies are suggested for addressing some of the systematic problems contributing to these high levels of misannotation.


Conflict of interest statement

The authors have declared that no competing interests exist.

Figures

Figure 1
Figure 1. Enzyme superfamilies and their constituent functional families examined in this analysis.
Families analyzed in this work are shown organized by the superfamilies to which they belong. Names of superfamilies and families are from the SFLD. E.C. numbers are included where available. Dashes (—) are used for those families for which a full E.C. number has yet to be assigned. Each family is designated by a specific color and these mappings are also used in Figure 3 and Video S1. The number of sequences in each family that were analyzed from each database is listed; the total number of sequences analyzed from each database is also given.
Figure 2
Figure 2. The misannotation analysis protocol.
Annotations determined to be incorrect are labelled with the following codes depending on the type of misannotation: ‘No Superfamily Association’ (NSA); ‘Missing Functionally important Residue(s)’ (MFR) ‘Superfamily Association only’ (SFA) ‘Below Trusted Cutoff’ (BTC). See Methods for more detailed discussion of these definitions.
Figure 3
Figure 3. Percent misannotation in the families and superfamilies tested.
The results are organized by superfamily: Panel A: enolase, B: crotonase, C: vicinal oxygen chelate, D: terpene cyclase, E: haloacid dehalogenase and F: amidohydrolase. Each panel depicts the percent misannotation for the superfamily in four plots, corresponding to the databases investigated. In each plot, the black bar denotes the average percent misannotation for that superfamily in that database. The percent misannotation for each family within the superfamily is given by a colored circle. The size of the circle provides an estimate of the number of sequences evaluated for that family (scaling in legend). An X through an open circle means that no sequences annotated with that function were retrieved from that database. The order of the families depicted for each superfamily is arbitrary but is consistent through all four plots. The colors of the family circles correspond to those used in Figure 1, which provide a mapping between these family colors and their gold standard functions.
Figure 4
Figure 4. The change in misannotation over time in the NR database for the 37 families investigated.
Sequences are plotted by the year when they were originally deposited in the database (x-axis). The number of sequences (left y-axis, bar graph) found to be correctly annotated is shown in green. The number of sequences found to be misannotated is shown in red. The bars for each year represent only the sequences deposited into the database in that year. The fraction (right y-axis, line plot) of sequences deposited each year into the NR database that were misannotated is given by the open nodes, connected by the black line to aid in visualizing the overall trend. This fraction represents the number of sequences in the 37 test families predicted to be misannotated divided by the total number of sequences deposited each year from the test set, i.e. the sum of the sequences depicted in the red and green bars for each year.
Figure 5
Figure 5. Distribution of major types of misannotation found in the NR database.
Classification of misannotated sequences follows the steps of the protocol given in Figure 2: ‘No Superfamily Association’ (NSA); ‘Missing Functionally important Residue(s)’ (MFR) ‘Superfamily Association only’ (SFA) ‘Below Trusted Cutoff’ (BTC), as described in methods. The codes were grouped into two sets that specify whether the misannotation is associated with overprediction or to other types of errors (e.g., missing a required residue).
Figure 6
Figure 6. Network view of a misannotated sequence.
The protein similarity network shows clustering of sequences from an all-by-all BLAST analysis of a subgroup of the enolase superfamily. Light grey nodes (circles): unknown function; dark grey nodes: sequences annotated in the SFLD but not examined in this analysis; colored nodes: sequences colored by SFLD annotation (as designated in Figure 1, enolase superfamily). Squares represent proteins that have been experimentally characterized and colored circles represent those in which residues known to be important for function and other characteristics for that specific family are conserved. Edges (lines) show BLAST connections between sequences that have an E-value at least as good as 10−50. Lengths of edges indicate that sequences in tightly clustered groups are relatively more similar to each other than sequences with few and distant connections. The sequence annotated in GenBank as a mandelate racemase (gi|17987990, yellow dot) clusters with fuconate dehydratases (red cluster) suggesting that it should be annotated as a fuconate dehydratase instead of as a mandelate racemase. The blue cluster containing two characterized mandelate racemases is not close to the fuconate dehydratase cluster, providing further evidence that this sequence is not a mandelate racemase.

Similar articles

Cited by

References

    1. Benson DA, Karsch-Mizrachi I, Lipman DJ, Ostell J, Sayers EW. GenBank. Nucleic Acids Res. 2009;37:D26–31. - PMC - PubMed
    1. Bork P, Bairoch A. Go hunting in sequence databases but watch out for the traps. Trends Genet. 1996;12:425–427. - PubMed
    1. Karp PD. What we do not know about sequence analysis and sequence databases. Bioinformatics. 1998;14:753–754. - PubMed
    1. Brenner SE. Errors in genome annotation. Trends Genet. 1999;15:132–133. - PubMed
    1. Devos D, Valencia A. Intrinsic errors in genome annotation. Trends Genet. 2001;17:429–431. - PubMed

Publication types