. 2009 Dec;5(12):e1000772.
doi: 10.1371/journal.pgen.1000772. Epub 2009 Dec 11.

Network properties of robust immunity in plants

Affiliations

Network properties of robust immunity in plants

Kenichi Tsuda et al. PLoS Genet. 2009 Dec.

Abstract

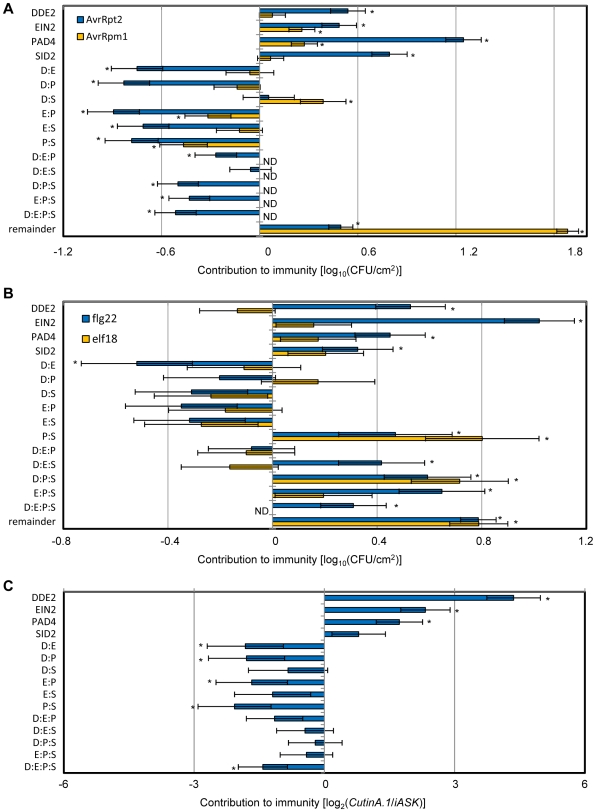
Two modes of plant immunity against biotrophic pathogens, Effector Triggered Immunity (ETI) and Pattern-Triggered Immunity (PTI), are triggered by recognition of pathogen effectors and Microbe-Associated Molecular Patterns (MAMPs), respectively. Although the jasmonic acid (JA)/ethylene (ET) and salicylic acid (SA) signaling sectors are generally antagonistic and important for immunity against necrotrophic and biotrophic pathogens, respectively, their precise roles and interactions in ETI and PTI have not been clear. We constructed an Arabidopsis dde2/ein2/pad4/sid2-quadruple mutant. DDE2, EIN2, and SID2 are essential components of the JA, ET, and SA sectors, respectively. The pad4 mutation affects the SA sector and a poorly characterized sector. Although the ETI triggered by the bacterial effector AvrRpt2 (AvrRpt2-ETI) and the PTI triggered by the bacterial MAMP flg22 (flg22-PTI) were largely intact in plants with mutations in any one of these genes, they were mostly abolished in the quadruple mutant. For the purposes of this study, AvrRpt2-ETI and flg22-PTI were measured as relative growth of Pseudomonas syringae bacteria within leaves. Immunity to the necrotrophic fungal pathogen Alternaria brassicicola was also severely compromised in the quadruple mutant. Quantitative measurements of the immunity levels in all combinatorial mutants and wild type allowed us to estimate the effects of the wild-type genes and their interactions on the immunity by fitting a mixed general linear model. This signaling allocation analysis showed that, contrary to current ideas, each of the JA, ET, and SA signaling sectors can positively contribute to immunity against both biotrophic and necrotrophic pathogens. The analysis also revealed that while flg22-PTI and AvrRpt2-ETI use a highly overlapping signaling network, the way they use the common network is very different: synergistic relationships among the signaling sectors are evident in PTI, which may amplify the signal; compensatory relationships among the sectors dominate in ETI, explaining the robustness of ETI against genetic and pathogenic perturbations.


Conflict of interest statement

The authors have declared that no competing interests exist.

Figures

Figure 1
Figure 1. The signaling network defined by the four genes accounts for ∼80% of AvrRpt2-ETI.
(A,C) Pto DC3000 EV (empty vector), AvrRpt2 (A) or AvrRpm1 (C) (OD600 = 0.0001) were infiltrated into leaves of Col-0, dde2, ein2, pad4, sid2, dde2/ein2/pad4/sid2 (quad), and rpm1/rps2. The bacterial number was measured at 0 dpi and 2dpi. Data were obtained in four independent experiments (including all genotypes) each with 4 or 12 biological replicates for 0 dpi or 2 dpi, respectively. For Col-0, the quadruple and rpm1/rps2, two additional independent experiments each with 4 or 16 biological replicates for 0 dpi or 2 dpi, respectively, were performed and data were integrated with other experiments. Bars represent means and standard errors of data collected in all independent experiments, combined by the mixed linear model. Green arrows indicate the levels of ETI. (B,D) ETI was estimated by subtracting bacterial number at 2 dpi in Pto DC3000 (AvrRpt2 or AvrRpm1)-inoculated plants from that in Pto DC3000 (EV)-inoculated plants. The ETI level of each mutant was compared with that of Col-0 using a two-tailed t-test, to obtain the P-values. (E) Four-week old Col-0 and the quadruple mutant.
Figure 2
Figure 2. The signaling network defined by the four genes accounts for ∼80% of flg22-PTI.
(A,C) Pto DC3000 (OD600 = 0.0001) was inoculated into the same leaves one day after pretreatment with water (mock), 1 µM flg22 (flg22) (A) or 1 µM elf18 (elf18) (C). The bacterial number was measured at 0 dpi and 2 dpi. Data were obtained in three (A) or four (B) independent experiments each with at least 4 or 12 biological replicates for 0 dpi or 2 dpi, respectively. Bars represent means and standard errors of data collected in all independent experiments, combined by the mixed linear model. Green arrows indicate the levels of PTI. (B,D) PTI was estimated by subtracting bacterial number at 2 dpi in flg22- (B) or elf18- (D) pretreated plants from that in mock-pretreated plants. The PTI level of each mutant was compared with that of Col-0 using a two-tailed t-test, to obtain the P-values.
Figure 3
Figure 3. Early signaling events in flg22 response are intact in the quadruple mutant.
(A) Eleven-day-old seedlings were treated with 1 µM flg22 and samples were collected 0 to 40 min after treatment as indicated. Activated MAPKs were detected by immunoblotting using anti-p44/42 MAPK antibody. Proteins were also detected with anti-AtMPK3 antibody. Experiments were conducted twice with similar results. Asterisks, non-specific bands. (B,C) Water (mock) or 1 µM flg22 (flg22) were infiltrated into 4-week-old leaves. Expression levels were measured by qRT-PCR. (B) Chitinase (At2g43620). (C) FRK1 (At2g19190). Bars represent means and standard errors of two biological replicates calculated by the mixed linear model. The vertical axis is the log2 expression level relative to that of Actin2 (At2g18780). Asterisks indicate significant differences from flg22-treated Col-0 (P<0.01, two-tailed t-tests). (D) Five-day-old seedlings were treated with or without 1 µM flg22 for 10 days. Three independent experiments were performed with approximately twenty seedlings per treatment per experiment. Bars represent means and standard errors of data collected in three independent experiments, combined by the mixed linear model. Arrows indicate flg22-induced seedling growth inhibition. Note that the vertical axis is the log10-transformed values. (E) Flg22-induced seedling growth inhibition was calculated by subtracting weight in flg22-treated seedlings from that in mock-treated seedlings. Two-tailed t-tests were used for P-values as in Figure 1B.
Figure 4
Figure 4. The quadruple mutant was highly susceptible to the necrotrophic pathogen Alternaria brassicicola.
(A) The damage caused by A. brassicicola was visualized by trypan blue staining 3 dpi. (B) Camalexin was extracted from inoculated leaves 3 dpi and quantified. Data were obtained in two independent experiments each with 12 biological replicates per treatment. Camalexin was not detectable (ND) in the pad3 mutant in which the enzyme for the last biosynthetic step is deficient . Bars represent means and standard errors of data collected in two independent experiments, combined by the mixed linear model. Note that the vertical axis is the log10-transformed values. (C) The log2 ratio of copy numbers of a fungal gene (CutinA.1) and a plant gene (iASK) was determined by qPCR and used as the disease index. Each sample consisted of 6 to 8 leaves or 16 to 18 for 0 dpi or 3 dpi, respectively, per genotype per experiment. Data were obtained in six independent experiments (including all genotypes). For Col-0, dde2, the quadruple and pad3, four additional independent experiments were performed and data were integrated with other experiments. Bars represent means and standard errors of data collected in all independent experiments, combined by the mixed linear model. Different letters indicate significantly different disease index values (a mixed linear model and two-tailed t-tests; P<0.0001).
Figure 5
Figure 5. Schematic illustration of the effects of genes and interactions in a signaling network consisting of three signaling sectors.
In an interconnected signaling network, not only each gene (signaling sector) but also interactions (interactions among signaling sectors) affect immunity. Colons represent interactions.
Figure 6
Figure 6. The defense signaling allocations.
Positive values represent positive contributions to immunity. (A) The signaling allocations for AvrRpt2- and AvrRpm1-ETI. The 3- and 4-gene interactions for AvrRpm1 were not determined (ND) since the model without the 3- and 4-gene interactions had the lowest Akaike's Information Criterion (AIC). (B) The signaling allocations for flg22- and elf18-PTI. The 4-gene interaction contribution for elf18 was not determined (ND) since the model without the 4-gene interaction had the lowest AIC. (C) The signaling allocations for immunity to A. brassicicola. D, DDE2; E, EIN2; P, PAD4; S, SID2. Colons indicate interactions. Bars represent means and standard errors determined by the mixed general linear model. Asterisks, significant effects or interactions (P<0.05).
Figure 7
Figure 7. Interpretations of signaling allocation analysis and of the interaction term.
(A) In the wild-type, effects of each gene and the remainder and their interactions contribute to AvrRpt2-ETI. In sid2, effects of DDE2, EIN2, PAD4 and the remainder and DDE2:EIN2, DDE2:PAD4, EIN2:PAD4 and DDE2:EIN2:PAD4 interactions contribute to AvrRpt2-ETI. In the quadruple mutant, only the remainder effect contributes to AvrRpt2-ETI. (B) Interpretation of an interaction term in a hypothetical network consisting of two sectors A and B. Effect A is the level of immunity in mutant b, and effect B in mutant a. If the sum of effects A and B is lower than the immunity level in WT, the A:B interaction is positive, indicating that there is a synergistic effect between sectors A and B. If the sum of effects A and B is equal to the immunity level in WT, the A:B interaction is zero, indicating that sectors A and B are independent. If the sum of effects A and B is higher than the immunity level in WT, the A:B interaction is negative, indicating that each of the sectors A and B can compensate for loss of the other.
Figure 8
Figure 8. Robust plant immunity is achieved by network compensation (Conceptual diagrams).
(A) Many genes (signaling network components, circles) are highly interconnected in the network. The network is not perfectly democratic because there is a primary signal flow, shown by a red arrow, when the network is intact. (B) None of the single sector disruptions have much effect on the output (restriction of pathogen growth), because the signal flow is rerouted, as shown by the blue arrow. (C) Disruption of a sufficient number of sectors results in loss of most output. (D) There could be different combinations of sector disruptions that result in similar levels of output reduction. Input, MAMPs or effectors; Output, pathogen growth inhibition; Large black circles, major hubs in signaling sectors; Triangles, plant defense components directly affecting pathogens; Grey arrows, circles and triangles mean disrupted connections, genes, and defense components, respectively.

Similar articles

Cited by

References

    1. Jones JD, Dangl JL. The plant immune system. Nature. 2006;444:323–329. - PubMed
    1. Chisholm ST, Coaker G, Day B, Staskawicz BJ. Host-microbe interactions: Shaping the evolution of the plant immune response. Cell. 2006;124:803–814. - PubMed
    1. Abramovitch RB, Anderson JC, Martin GB. Bacterial elicitation and evasion of plant innate immunity. Nat Rev Mol Cell Biol. 2006;7:601–611. - PMC - PubMed
    1. Zipfel C, Robatzek S, Navarro L, Oakeley EJ, Jones JD, et al. Bacterial disease resistance in Arabidopsis through flagellin perception. Nature. 2004;428:764–767. - PubMed
    1. Zipfel C, Kunze G, Chinchilla D, Caniard A, Jones JD, et al. Perception of the bacterial PAMP EF-tu by the receptor EFR restricts Agrobacterium-mediated transformation. Cell. 2006;125:749–760. - PubMed

Publication types