. 2009 Nov 26:3:26.
doi: 10.3389/neuro.10.026.2009. eCollection 2009.

Capturing dopaminergic modulation and bimodal membrane behaviour of striatal medium spiny neurons in accurate, reduced models

Affiliations

Capturing dopaminergic modulation and bimodal membrane behaviour of striatal medium spiny neurons in accurate, reduced models

Mark D Humphries et al. Front Comput Neurosci. .

Abstract

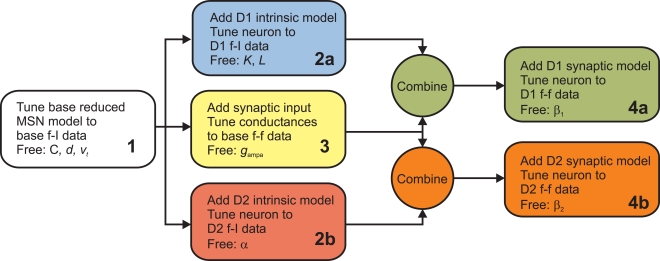
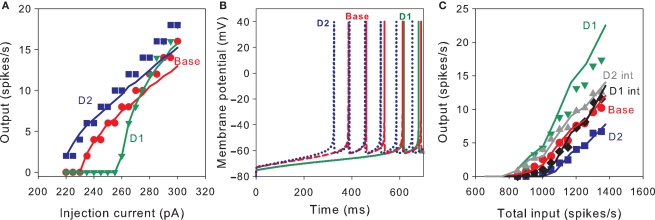
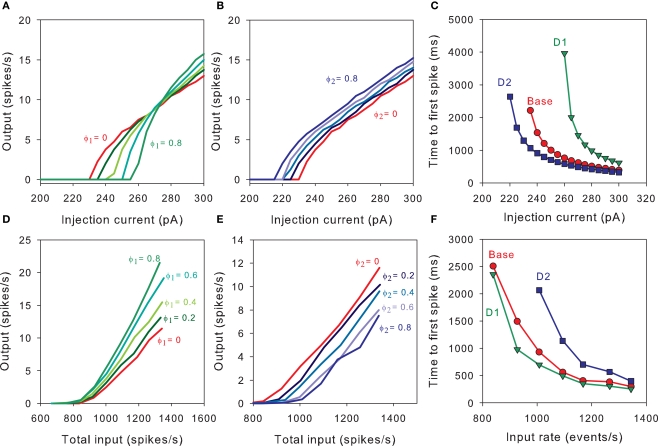
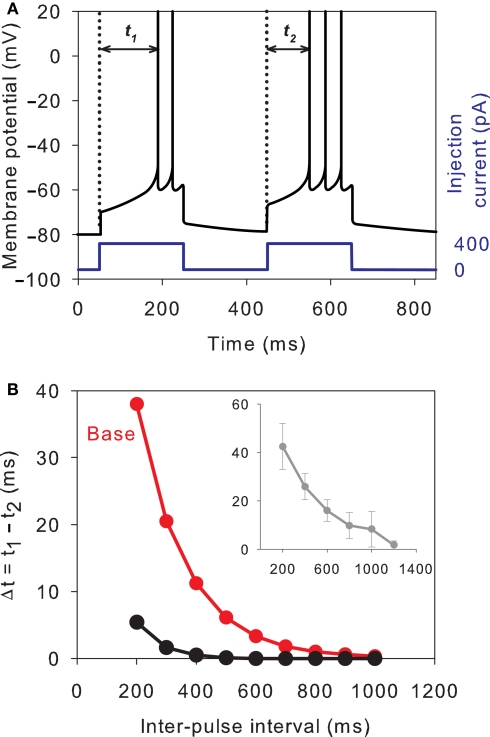
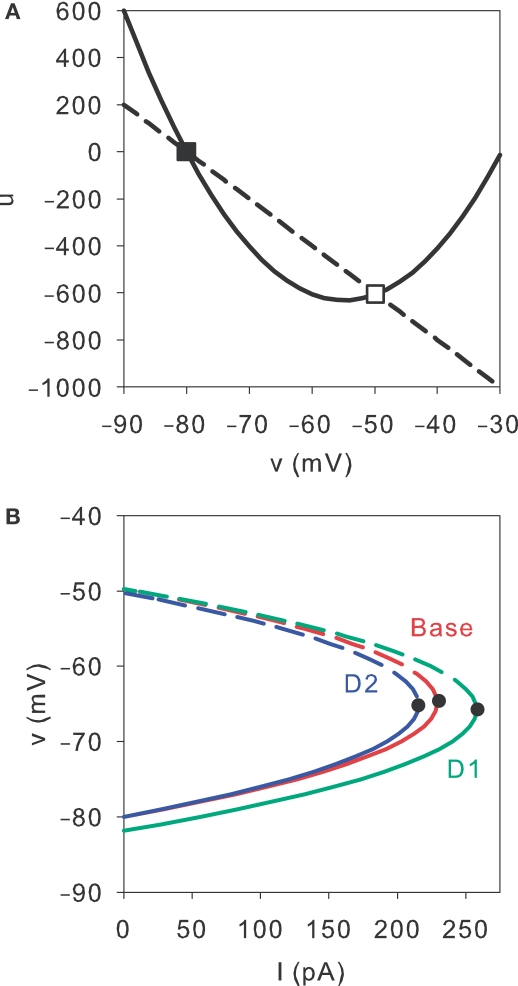
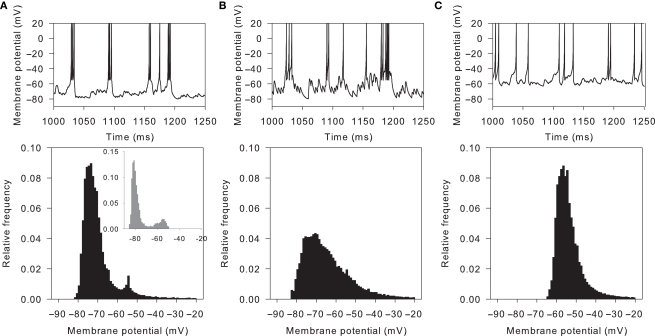
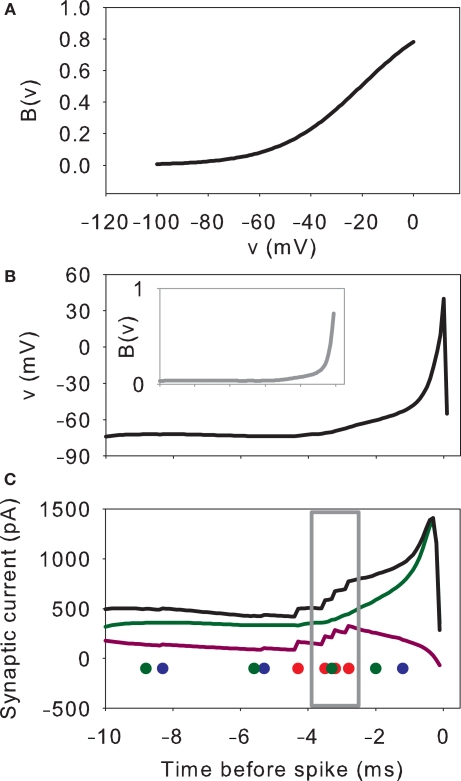
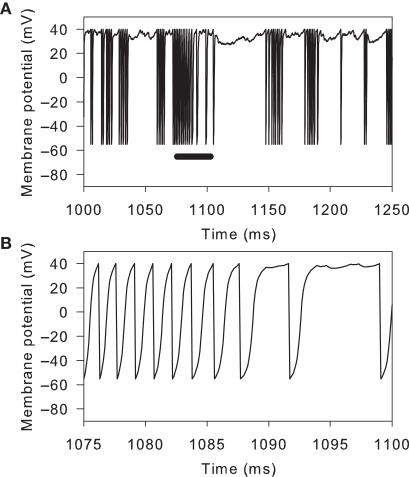
Loss of dopamine from the striatum can cause both profound motor deficits, as in Parkinson's disease, and disrupt learning. Yet the effect of dopamine on striatal neurons remains a complex and controversial topic, and is in need of a comprehensive framework. We extend a reduced model of the striatal medium spiny neuron (MSN) to account for dopaminergic modulation of its intrinsic ion channels and synaptic inputs. We tune our D1 and D2 receptor MSN models using data from a recent large-scale compartmental model. The new models capture the input-output relationships for both current injection and spiking input with remarkable accuracy, despite the order of magnitude decrease in system size. They also capture the paired pulse facilitation shown by MSNs. Our dopamine models predict that synaptic effects dominate intrinsic effects for all levels of D1 and D2 receptor activation. We analytically derive a full set of equilibrium points and their stability for the original and dopamine modulated forms of the MSN model. We find that the stability types are not changed by dopamine activation, and our models predict that the MSN is never bistable. Nonetheless, the MSN models can produce a spontaneously bimodal membrane potential similar to that recently observed in vitro following application of NMDA agonists. We demonstrate that this bimodality is created by modelling the agonist effects as slow, irregular and massive jumps in NMDA conductance and, rather than a form of bistability, is due to the voltage-dependent blockade of NMDA receptors. Our models also predict a more pronounced membrane potential bimodality following D1 receptor activation. This work thus establishes reduced yet accurate dopamine-modulated models of MSNs, suitable for use in large-scale models of the striatum. More importantly, these provide a tractable framework for further study of dopamine's effects on computation by individual neurons.

Keywords: bimodality; bistability; phase plane analysis; signal-to-noise ratio; striatum.


Conflict of interest statement

The authors declare that the research was conducted in the absence of any commercial or financial relationships that could be construed as a potential conflict of interest.

Figures

Figure 1
Figure 1
Flow chart of the parameter fitting process. We follow this series of steps to tune the basic reduced MSN model parameters and our dopamine model parameters to fit data from Moyer et al.’s (2007) current-frequency (f–I) and frequency–frequency (f–f) curves, derived from their corresponding multi-compartment models.
Figure 2
Figure 2
Tuning the MSN models. (A) Current–frequency (f–I) curves. Mean firing rate responses of no dopamine (red), D1-type (green) and D2-type (blue) striatal MSN models to current injection. Symbols are the f–I curves from the Moyer et al. (2007) model. Solid lines are the corresponding f–I curves of our tuned neuron models (Stages 1, 2a and 2b): parameters C, d, and vt were tuned to fit the no dopamine f–I curve only; D1 model parameters K and L only were tuned to fit the D1-type f–I curve; D2 model parameter α only was tuned to fit the D2-type f–I curve. (B) Single neuron response to 270 pA current injection for the tuned basic MSN model (red, dashed), the addition of the D1 intrinsic model (green, solid), and the addition of the D2 intrinsic model (blue, dotted). Each shows the characteristic delay to first spike of the MSN, and are correctly ordered so that the activation of D2 receptors produces a spike faster than the dopamine-free model, which in turn is faster than the D1-receptor model. (C) Input frequency–output frequency (f–f) responses: no dopamine (red), D1-complete (green), and D2-complete (blue) striatal MSN models. Symbols are the f–f curves from the Moyer et al. model. Solid lines give the corresponding f–f curves of our tuned neuron models (Stages 3, 4a and 4b), again showing good matches to the responses from the multi-compartment model. Our intrinsic D1 (black) and D2 (grey) models also fit the f–f curves of their corresponding Moyer et al. models: the extent of these fits is surprisingly good, given that no tuning could be done for these fits.
Figure 3
Figure 3
Predictions of the MSN models. (A) The D1 intrinsic model predicts a D1-activation dependent increase in effective signal-to-noise ratio of the MSN's output. The f–I curves increase in slope, but the rheobase current is higher than baseline, hence the MSN's output shows a higher signal-to-noise ratio than baseline. (B) The D2 intrinsic model predicts an orderly set of f–I curves that left-shift (decreasing rheobase, same slope) with increasing D2 activation. D2 activation of intrinsic ion channels is thus always facilitatory. (C) Time-to-first-spike across a range of injection currents for our tuned basic, D1-intrinsic, and D2-intrinsic MSN models. The models predict that the temporal order relationship D2 activation < basic model < D1 activation is maintained across a wide range of current injections, and converges at moderately large currents (shown for ϕ1 = ϕ2 = 0.8). (D) The D1 complete model predicts that increasing D1 activation from baseline consistently increases the sensitivity of the MSN to synaptic input. (E) The D2 complete model predicts that increasing D2 activation from baseline consistently decreases the MSN's sensitivity to synaptic input. (F) Our complete models predict that the time-to-first-spike relationships are inverted for synaptic input compared to current injection (C), but similarly converge (shown for ϕ1 = ϕ2 = 0.8; points are averaged over 5 runs).
Figure 4
Figure 4
Paired-pulse facilitation in the reduced MSN models. (A) The basic tuned MSN model shows paired-pulse facilitation to current pulses delivered 200 ms apart. The facilitation is quantified as the difference in time from onset of the pulse to the peak of the first spike: Δt = t1t2. (B) The amount of paired-pulse facilitation fell off exponentially with increasing inter-pulse interval, returning to baseline after 1000 ms. This replicates the fall-off and baseline-return time recorded in vivo by Mahon et al. (2000a) – their data is replotted inset in grey. Increasing the effective inactivation time-constant of the A-type potassium channel (setting a = 0.02) strongly attenuates the paired-pulse facilitation (black line).
Figure 5
Figure 5
Stability of the MSN model's fixed points. (A) Without injection current, two fixed-points are defined by the intersection of the v-nullcline (solid) and the u-nullcline (dashed). The first is a stable node (filled square); the second is a saddle (open square). (B) Increasing injection current causes a saddle-node bifurcation. The MSN model always had two fixed points: a stable node (solid line) and a saddle (dashed line). The point where these curves meet (black dots) corresponds to the bifurcation point I0. At higher currents, there are no fixed points, and the neuron model spikes – hence I0 is also the rheobase current. We can see that the two dopamine models do not alter the fixed point structure, but rather translate the fixed-point trajectories so that I0 occurs at higher (D1 model) or lower (D2 model) injection currents. These curves were obtained for the particular set of MSN model parameters used in this paper, and were plotted using I as a function of v from: baseline model, Eq. 14; D1 model, Eq. 14 with vrvr(1 + Kϕ1); D2 model, Eq. 14 with k ← (1 − αϕ2)k. Dopamine levels were ϕ1 = ϕ2 = 0.8.
Figure 6
Figure 6
Massive NMDA conductance increase causes spontaneous bimodality of model MSN membrane potential. Top row: membrane potential traces from 250 ms of simulation. Bottom row: corresponding histograms of membrane potential values for 4 s of the simulation. (A) Tuned baseline MSN model can show a spontaneously bimodal membrane potential, with an NMDA agonist model that assumes slow, irregular, massive increases in NMDA conductance (here m = 100, r = 4 Hz). The resulting membrane potential histogram clearly shows a bimodal distribution, with similar peak centres to those observed in the in vitro studies (inset; histogram redrawn from Carrillo-Reid et al., 2008). (B) Multiplying AMPA conductance instead to achieve the same number of spikes does not similarly cause bimodality in the membrane potential (using m = 5, r = 3 Hz for the AMPA synapses, giving approximately the same total number of spikes as in panel A). (C) Removing the NMDA receptor blockade (Eq. 9) also prevented bimodality in the membrane potential (using m = 12.5, r = 2 Hz for the NMDA synapses, giving approximately the same total number of spikes as in (A)).
Figure 7
Figure 7
Mechanism of rapid down-to-up state membrane potential jump through NMDA conductance amplification and receptor blockade. (A) NMDA current gating function B(v). (B) Example spike peak and preceding 10 ms of membrane potential. Inset shows corresponding time-course of B(v). (C) Synaptic currents and receptor events during that 10 ms. We plot the gated NMDA current (B(v)Inmda; green), the sum of AMPA and GABAa currents (Iampa + Igaba; purple), and resulting total synaptic current (black). The dots indicate the time of synaptic events: NMDA (green), AMPA (red), and GABA (blue). Single synaptic events cause very small deflections in the membrane potential voltage in the down-state (e.g. between 10 and 8 ms before the spike). A cluster of excitatory synaptic events (grey box) can sufficiently increase the membrane potential to set off a positive feedback loop between v and B(v)Inmda: beyond this point, each increase in v increases B(v)Inmda, which in turn increases v, and so on. The feedback is terminated when the voltage nears or crosses the reversal potential for NMDA, at 0 mV in this model. Hence, the membrane potential appears to move between two regimes, even if the neuron is not intrinsically bistable. The irregularity of the up/down transitions in the model is due to the random occurrence of sufficiently-depolarising clusters of synaptic events: if any of the events within the grey box is manually removed from the simulation, the spike fails to occur.
Figure 8
Figure 8
Disrupted spike behaviour in the reduced models with massive excitatory conductance. Applying too large a multiplier to the NMDA conductance causes the voltage trajectory to wander just before a spike peak. This example uses m = 200 and r = 4 Hz. (A) A 250 ms segment of membrane potential, showing bursts of rapid spiking separated by inter-burst voltages near spike peaks. (B) Replotting the segment along the black bar in panel A shows an example of the membrane potential rapidly depolarising towards the spike peak but interrupted by a prolonged period of membrane potential fluctuation. These periods are due to one or more NMDA receptor events occurring after the membrane potential has passed the NMDA reversal potential (here 0 mV). With the massively increased conductance, the events have a significant inhibitory effect on the membrane potential, delaying its rise. However, the spike-peak is eventually reached, as the model has no stable states under this level of equivalent current injection (see Stability of Fixed Points).

Similar articles

Cited by

References

    1. Albin R. L., Young A. B., Penney J. B. (1989). The functional anatomy of basal ganglia disorders. Trends Neurosci. 12, 366–375.10.1016/0166-2236(89)90074-X - DOI - PubMed
    1. Bolam J. P., Bergman H., Graybiel A. M., Kimura M., Plenz D., Seung H. S., Surmeier D. J., Wickens J. R. (2006). Microcircuits in the striatum. In Microcircuits: The Interface Between Neurons and Global Brain Function, Grillner S., Graybiel A. M., eds (Cambridge, MA, MIT Press; ), pp. 165–190.
    1. Carrillo-Reid L., Tecuapetla F., Tapia D., Hernández-Cruz A., Galarraga E., Drucker-Colin R., Bargas J. (2008). Encoding network states by striatal cell assemblies. J. Neurophysiol. 99, 1435–1450.10.1152/jn.01131.2007 - DOI - PubMed
    1. Dawson T. M., Gehlert D. R., McCabe R. T., Barnett A., Wamsley J. K. (1986). D-1 dopamine receptors in the rat brain: a quantitative autoradiographic analysis. J. Neurosci. 6, 2352–2365. - PMC - PubMed
    1. Djurfeldt M., Ekeberg O., Lansner A. (2008). Large-scale modeling – a tool for conquering the complexity of the brain. Front. Neuroinform. 2, 1.10.3389/neuro.11.001.2008 - DOI - PMC - PubMed