. 2009 Dec 11;4(12):e8250.
doi: 10.1371/journal.pone.0008250.

Feature selection and classification of MAQC-II breast cancer and multiple myeloma microarray gene expression data

Affiliations

Feature selection and classification of MAQC-II breast cancer and multiple myeloma microarray gene expression data

Qingzhong Liu et al. PLoS One. .

Abstract

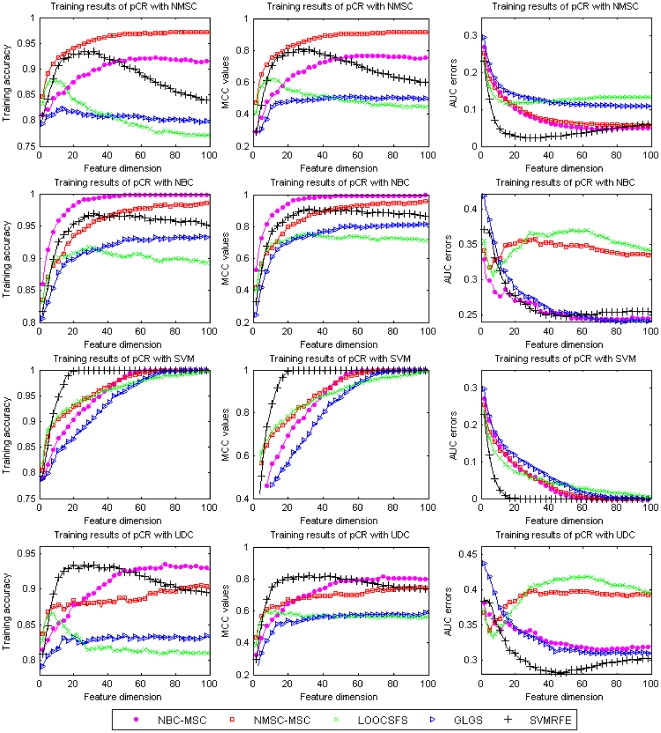
Microarray data has a high dimension of variables but available datasets usually have only a small number of samples, thereby making the study of such datasets interesting and challenging. In the task of analyzing microarray data for the purpose of, e.g., predicting gene-disease association, feature selection is very important because it provides a way to handle the high dimensionality by exploiting information redundancy induced by associations among genetic markers. Judicious feature selection in microarray data analysis can result in significant reduction of cost while maintaining or improving the classification or prediction accuracy of learning machines that are employed to sort out the datasets. In this paper, we propose a gene selection method called Recursive Feature Addition (RFA), which combines supervised learning and statistical similarity measures. We compare our method with the following gene selection methods: Support Vector Machine Recursive Feature Elimination (SVMRFE), Leave-One-Out Calculation Sequential Forward Selection (LOOCSFS), Gradient based Leave-one-out Gene Selection (GLGS). To evaluate the performance of these gene selection methods, we employ several popular learning classifiers on the MicroArray Quality Control phase II on predictive modeling (MAQC-II) breast cancer dataset and the MAQC-II multiple myeloma dataset. Experimental results show that gene selection is strictly paired with learning classifier. Overall, our approach outperforms other compared methods. The biological functional analysis based on the MAQC-II breast cancer dataset convinced us to apply our method for phenotype prediction. Additionally, learning classifiers also play important roles in the classification of microarray data and our experimental results indicate that the Nearest Mean Scale Classifier (NMSC) is a good choice due to its prediction reliability and its stability across the three performance measurements: Testing accuracy, MCC values, and AUC errors.


Conflict of interest statement

Competing Interests: The authors have declared that no competing interests exist.

Figures

Figure 1
Figure 1. Comparison of different gene selection methods for prediction of erpos status of MAQC-II breast cancer dataset with different learning classifiers.
X-axis shows the number of used features and Y-axis shows average values of the testing accuracy (left column), MCC values (middle column), and AUC errors (right column) of twenty-time experiments, respectively.
Figure 2
Figure 2. Comparison of different gene selection methods for prediction of pCR status of MAQC-II breast cancer dataset with different learning classifiers.
X-axis shows the number of used features and Y-axis shows average values of the testing accuracy (left column), MCC values (middle column), and AUC errors (right column) of twenty-time experiments, respectively.
Figure 3
Figure 3. Average erpos prediction performance by using MAQC-II breast cancer dataset with the measurements testing accuracy (left column), MCC values (middle column), and AUC errors (right column), respectively.
Classification models are setup based on the best training. In each column, the best combination of gene selection and classifier is highlighted by a red dash circle. If there are multiple best combinations, or the difference of these combinations is not conspicuous, multiple circles are placed.
Figure 4
Figure 4. Average pCR prediction performance by using MAQC-II breast cancer dataset with the measurements testing accuracy (left column), MCC values (middle column), and AUC errors (right column), respectively.
Classification models are setup based on the best training. In each column, the best combination of gene selection and classifier is highlighted by a dash circle.
Figure 5
Figure 5. Average EFSMO prediction performance by using MAQC-II multiple myeloma dataset with the measurements testing accuracy (left column), MCC values (middle column), and AUC errors (right column), respectively.
Classification models are setup based on the best training. In each column, the best combination of gene selection and classifier is highlighted by a dash circle.
Figure 6
Figure 6. Average OSMO prediction performance by using MAQC-II multiple myeloma dataset with the measurements testing accuracy (left column), MCC values (middle column), and AUC errors (right column), respectively.
Classification models are setup based on the best training. In each column, the best combination of gene selection and classifier is highlighted by a dash circle. If there are multiple best combinations, or the difference of these combinations is not conspicuous, multiple circles are placed.
Figure 7
Figure 7. Comparison of different gene selection methods for the training of pCR endpoint of MAQC-II breast cancer dataset using the four classifiers.
X-axis shows the number of used features and Y-axis shows average values of the training accuracy (left column), MCC values (middle column), and AUC errors (right column) of twenty-time experiments, respectively.

Similar articles

Cited by

References

    1. Chen Z, McGee M, Liu Q, Scheuermann RH. A distribution free summarization method for affymetrix genechip arrays. Bioinformatics. 2007;23(3):321–327. - PubMed
    1. Hand DJ, Heard NA. Finding groups in gene expression data. J Biomed Biotechnol. 2005;2005(2):215–225. - PMC - PubMed
    1. Qin Z. Clustering microarray gene expression data using weighted Chinese restaurant process. Bioinformatics. 2006;22(16):1988–1997. - PubMed
    1. Quackenbush J. Computational analysis of microarray data. Nature Rev Genetic. 2001;2:418–427. - PubMed
    1. Segal E, Friedman N, Kaminski N, Regev A, Koller D. From signatures to models: understanding cancer using microarrays. Nature Genetics. 2005;37:S38–45. - PubMed

Publication types

Substances