. 2008 Aug;21(3):193-212.
doi: 10.1055/s-2008-1080999.

Computed tomography enterography and magnetic resonance enterography: the future of small bowel imaging

Affiliations

Computed tomography enterography and magnetic resonance enterography: the future of small bowel imaging

Mark E Baker et al. Clin Colon Rectal Surg. 2008 Aug.

Abstract

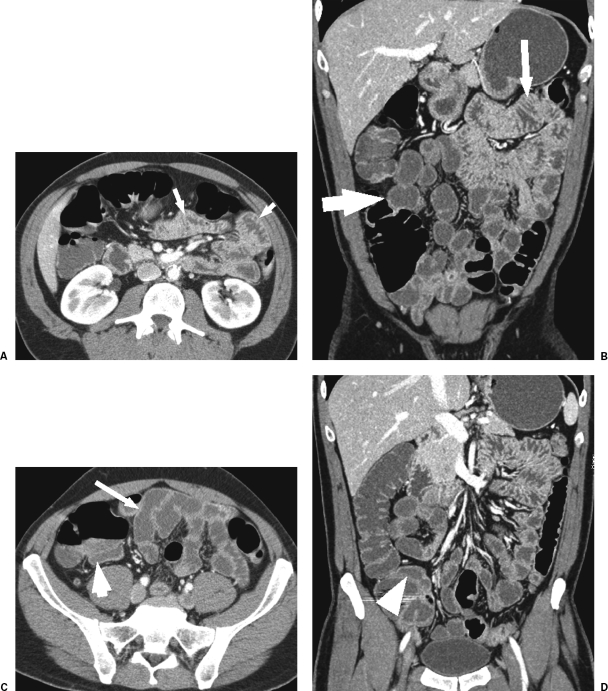
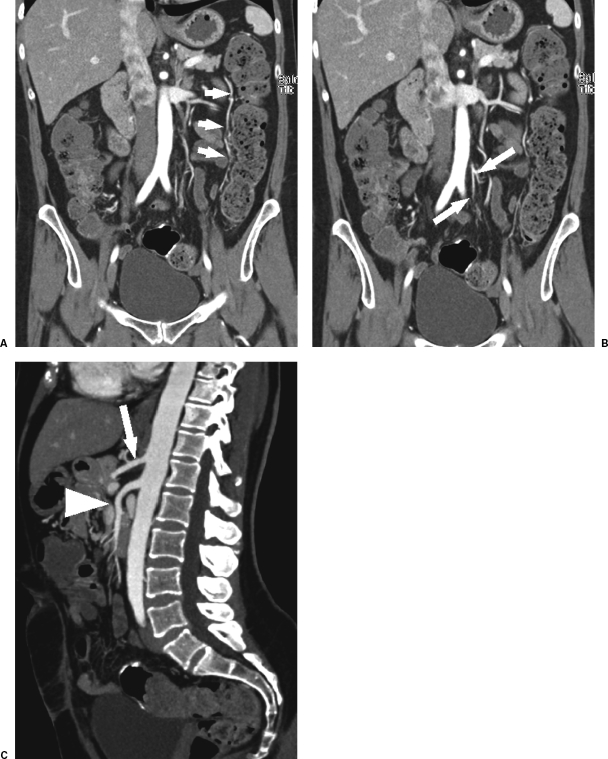
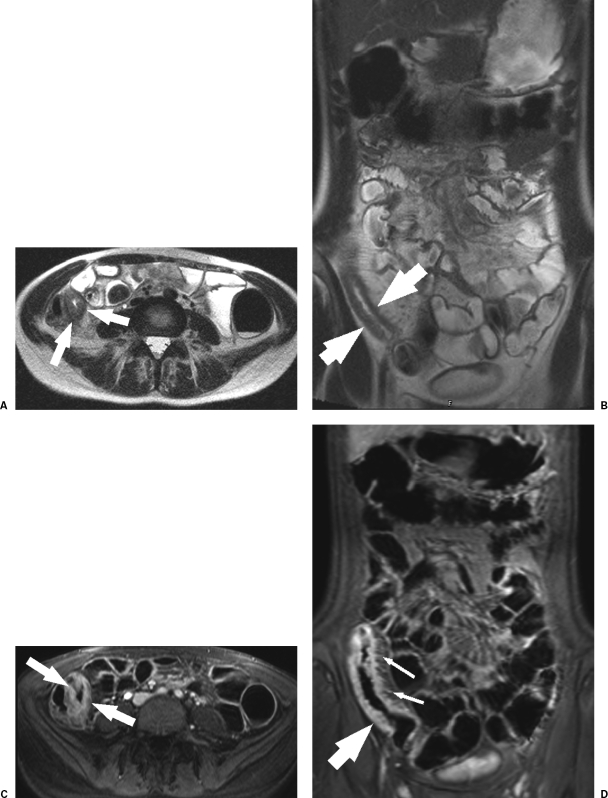
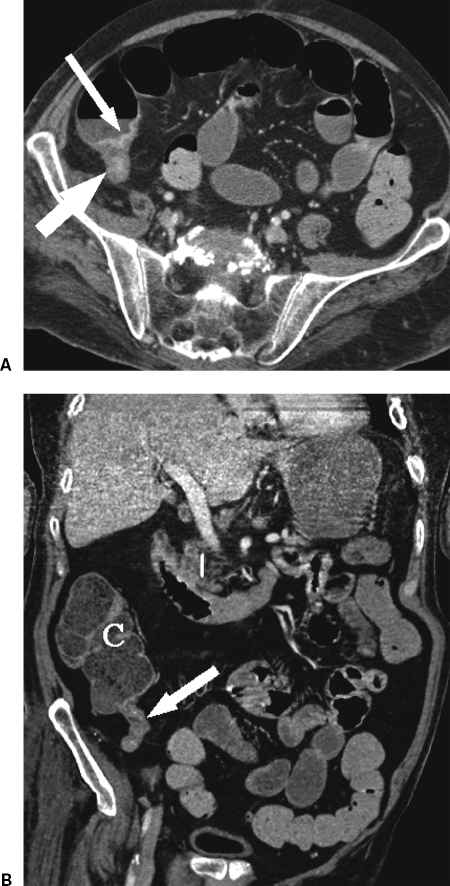
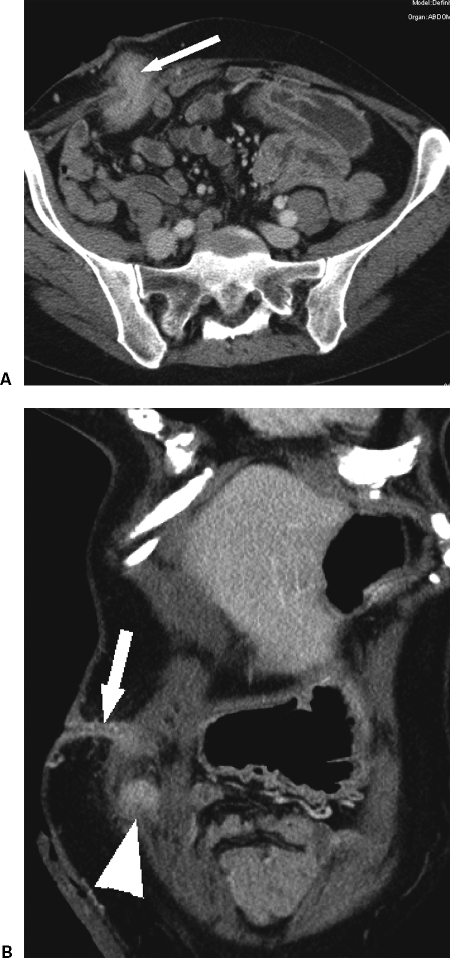
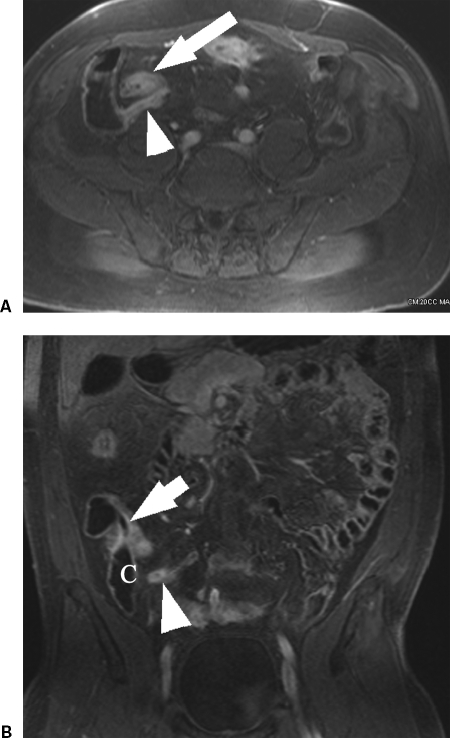
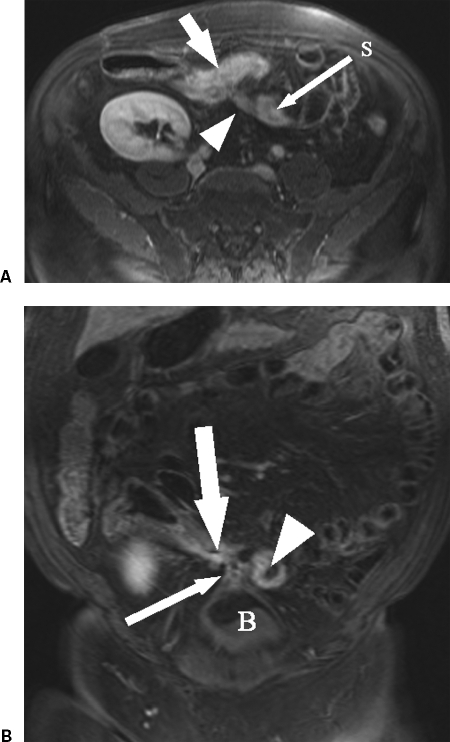
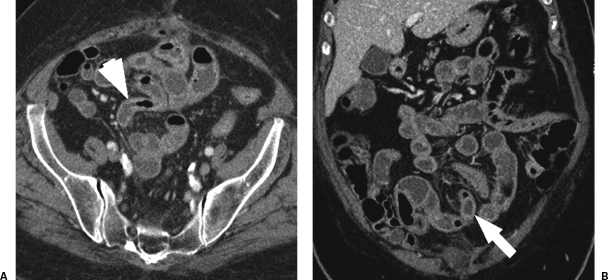
In the last 5 years, computed tomography enterography (CTE) and to a lesser extent magnetic resonance enterography (MRE) have supplanted the routine small bowel series and enteroclysis in the evaluation of many small bowel diseases, especially Crohn's disease. Both CTE and MRE use similar methods of bowel lumen opacification and distension and both have distinct advantages and disadvantages. Both have been most extensively studied in patients with Crohn's disease. What is certain is that these cross-sectional examinations have largely replaced the historic fluoroscopic examinations in the evaluation of the small bowel.

Keywords: Computed tomography enterography; Crohn's disease; chronic obscure gastrointestinal bleeding; magnetic resonance enterography.


Figures

Figure 1
Figure 1
(A) Normal uniphasic computed tomography enterography (CTE). Axial scan through the upper abdomen shows the normal, redundant, fold pattern of the jejunum (arrows). The lumen is filled with low Hounsfield unit oral contrast media. (B) Normal uniphasic CTE. Coronal, thin MIP (maximum intensity projection) reconstruction of thin slice axial CTE data. Scan shows the normal, redundant fold pattern of the jejunum (long, thin arrow) and the normal, smooth fold pattern of the ileum (short, fat arrow). (C) Normal uniphasic CTE. Axial scan through the pelvis shows the smooth fold pattern of the ileum (long, thin arrow). The terminal ileum (short, fat arrow) is distended by low Hounsfield oral contrast media. (D) Normal uniphasic CTE. Coronal, thin MIP reconstruction shows the normal terminal ileum (arrowhead).
Figure 2
Figure 2
(A) Normal biphasic computed tomography enterography (CTE). Coronal, thin MIP (maximum intensity projection) reconstruction obtained during the arterial phase (first phase of a biphasic CTE) shows the normal left colic artery (arrows). More superiorly the left colic becomes the marginal artery. (B) Normal biphasic CTE. Coronal, thin MIP reconstruction obtained during the arterial phase (first phase of a biphasic CTE) shows branches of the inferior mesenteric artery (arrows). (C) Normal biphasic CTE. Sagittal, thin MIP reconstruction shows the origin of the celiac axis (arrow) and superior mesenteric artery (arrowhead).
Figure 3
Figure 3
(A) Magnetic resonance enterography (MRE) of distal ileal Crohn's disease. Axial T2-weighted, HASTE (half-Fourier acquisition single-shot turbo spin-echo) scan thru the terminal ileum (arrows) shows marked wall thickening. (B) MRE of distal ileal Crohn's disease. Coronal T2-weighted HASTE scan through the terminal ileum (arrows) shows marked wall thickening. (C) MRE of distal ileal Crohn's disease. Axial, postcontrast T1-weighted, gradient echo, fat-suppressed, 3D scan through the affected terminal ileum shows near uniform, wall hyperenhancement (arrows) (there is almost no mural stratification) with luminal narrowing (stricture). (D) MRE of distal ileal Crohn's disease. Coronal, postcontrast T1-weighted, gradient echo, fat-suppressed, 3D scan through the affected terminal ileum shows near uniform, wall hyperenhancement with luminal narrowing (large arrow); thus there is a stricture. The vas recta are engorged (known as the Comb sign) (thin arrows).
Figure 4
Figure 4
(A) Computed tomography enterography (CTE) of strictured, ileal Crohn's disease. Axial scan through the pelvis shows narrowed, strictured neo-terminal ileum (large arrow). Note the thin, inner wall hyperenhancement and the peripheral wall hypoenhancement giving a target appearance or mural stratification. Additionally, the inner porton of the wall of the immediate upstream ileum (long, small arrow) also hyperenhances. The stricture causes significant upstream obstruction. (B) CTE of strictured, ileal Crohn's disease. Coronal, thin MIP (maximum intensity projection) scan through the pelvis shows narrowed, strictured neo-terminal ileum (arrow) just proximal to the cecum (C).
Figure 5
Figure 5
(A) Computed tomography enterography (CTE) of distal ileal Crohn's disease. Axial scan through the pelvis shows a long segment of disease proximal to an end ileostomy (arrows). Note the inner wall enhancement (mural stratification) is thicker than in Fig. 3. There is mild to moderate upstream small bowel (B) dilation. Interestingly, the endoscopy was normal, but the pathology was positive for active disease. (B) CTE of distal ileal Crohn's disease. Coronal thin MIP (maximum intensity projection) reconstruction through the pelvis shows a long segment of disease proximal to an end ileostomy (arrows).
Figure 6
Figure 6
(A) Computed tomography enterography (CTE) of distal ileal Crohn's disease with an abscess. Axial scan through the pelvis shows a short segment, distal ileal stricture (arrow). The inner wall enhancement is minimal. The bowel (B) upstream is mildly dilated. (B) CTE of distal ileal Crohn's disease with an abscess. Coronal, thin MIP (maximum intensity projection) reconstruction through the pelvis shows the marked wall thickening of the distal ileum (arrows) with only minimal inner wall enhancement. (C) CTE of distal ileal Crohn's disease with an abscess. Axial scan just above the stricture shows an abscess containing gas (arrows). (D) CTE of distal ileal Crohn's disease with an abscess. Coronal, thin MIP (maximum intensity projection) reconstruction just above the stricture shows an abscess (arrows).
Figure 7
Figure 7
(A) Computed tomography enterography (CTE) of multiple, obstructing, strictured Crohn's disease. Axial scan shows a short segment jejunal stricture (arrow) with marked, upstream small bowel (B) dilation. There are multiple, downstream jejunal and ileal strictures (arrowheads). Note the mural stratification. (B) CTE of multiple, obstructing, strictured Crohn's disease. Coronal, thin MIP (maximum intensity projection) reconstruction shows a short segment jejunal stricture (long, thin arrow) with marked, upstream small bowel (B) dilation. There are enteroliths (arrowhead) just above the stricture. There are multiple, downstream jejunal and ileal strictures (arrows).
Figure 8
Figure 8
(A) Computed tomography enterography (CTE) in a patient with Crohn's disease and four jejunal strictures and one proximal ileal stricture. Axial scan shows the most proximal jejunal stricture (arrow). (B) CTE in a patient with Crohn's disease and four jejunal strictures and one proximal ileal stricture. Coronal, MIP (maximum intensity projection) reconstruction shows the most proximal jejunal stricture (arrow) and dilated jejunum (J) upstream to the stricture. (C) CTE in a patient with Crohn's disease and four jejunal strictures and one proximal ileal stricture. Axial scan shows the proximal ileal stricture (arrow). (D) CTE in a patient with Crohn's disease and four jejunal strictures and one proximal ileal stricture. Coronal, thin MIP shows proximal ileal stricture (arrow).
Figure 9
Figure 9
(A) Computed tomography enterography (CTE) of end ileostomy Crohn's disease with enterocutaneous fistula. Axial scan shows that the end ileostomy bowel wall (arrow) nearly uniformly enhances. (B) CTE of end ileostomy Crohn's Disease with enterocutaneous fistula. Coronal, thin MIP (maximum intensity projection) reconstruction through the end ileostomy (arrowhead) shows the fistula (arrow).
Figure 10
Figure 10
(A) Magnetic resonance enterography (MRE) of distal ileal Crohn's disease with an ileocolic fistula. Axial T1-weighted, gradient echo, fat-suppressed, three-dimensional (3D) scan through the terminal ileum (TI) (arrow) shows a thickened, hyperenhancing bowel wall and a fistula (arrowhead) from the TI to the cecum. The TI is strictured. (B) MRE of distal ileal Crohn's disease with an ileocolic fistula. Coronal T1-weighted, gradient echo, fat-suppressed, 3D scan through terminal ileum (TI) (arrow) shows the start of the TI to cecal (C) fistula (arrowhead).
Figure 11
Figure 11
(A) Magnetic resonance enterography (MRE) of Crohn's disease with complex pelvic fistulae. Axial T1-weighted, gradient echo, fat-suppressed, three-dimensional (3D) scan through the distal ileum (short, fat arrow) shows a fistula (arrowhead) between the ileum and the sigmoid (long arrow with S). The distal ileal wall uniformly hyperenhances, is thickened and strictured. (B) MRE of distal ileal Crohn's disease with complex pelvic fistulae. Coronal T1-weighted, gradient echo, fat-suppressed, 3D scan through the distal ileum (short, fat arrow) shows the complex fistulae between the distal ileum (long arrow), the sigmoid (arrowhead), and the urinary bladder (B).
Figure 12
Figure 12
(A) Computed tomography enterography (CTE) of radiation enteritis. Axial scan shows mural stratification (arrowhead) in a mildly thick walled small bowel loop. (B) CTE of radiation enteritis. Coronal, thin MIP (maximum intensity projection) reconstruction shows mural stratification (arrow) in a mildly thick walled small bowel loop.
Figure 13
Figure 13
(A) Biphasic computed tomography enterography (CTE) of metastatic, distal ileal carcinoid. Axial scan through the pelvis during the arterial contrast enhancement phase of the examination shows a small, hyperenhancing polypoid mass (arrow) representing the primary carcinoid tumor. (B) Biphasic CTE of metastatic, distal ileal carcinoid. Axial scan through the pelvis during the portal venous contrast enhancement phase of the examination shows a small, hyperenhancing polypoid mass (arrow) representing the primary carcinoid tumor. During this phase of the examination, the mass is not as well seen. (C) Biphasic CTE of metastatic, distal ileal carcinoid. Coronal, thin MIP (maximum intensity projection) reconstruction through the pelvis during the arterial phase of the examination shows a small, hyperenhancing polypoid mass (arrow) representing the primary carcinoid tumor. Hyperenhancing, hepatic metastases are also identified (arrowheads).
Figure 14
Figure 14
(A) Computed tomography enterography (CTE) of obscure gastrointestinal bleeding in a patient with a Plasma cell neoplasm. Axial scan through the pelvis shows a large, nonobstructing, ulcerated mass (arrows) in continuity with the small bowel. (B) CTE of obscure gastrointestinal bleeding in a patient with a plasma cell neoplasm. Coronal, thin MIP (maximum intensity projection) reconstruction shows a large, nonobstructing, ulcerated mass (arrows) in continuity with the small bowel. There is confluent lymphadenopathy (L.N.) in the mesenteric root.
Figure 15
Figure 15
(A) Computed tomography enterography (CTE) in obscure gastrointestinal bleeding in a patient with cecal arteriovenous malformation (AVM). Axial scan obtained during the arterial contrast enhancement phase of a biphasic examination shows a tangle of vessels (arrows) adjacent to the cecum (arrowhead). (B) CTE in Obscure gastrointestinal bleeding in a patient with cecal AVM. Coronal, thin MIP (maximum intensity projection) reconstruction obtained during the arterial contrast enhancement phase of a biphasic examination shows a tangle of vessels (arrows) adjacent to the cecum (C).

Similar articles

Cited by

References

    1. Prokop M. Multislice CT: technical principles and future trends. Eur Radiol. 2003;13(Suppl 5):M3–M13. - PubMed
    1. Horton K M, Fishman E K. Volume-rendered 3D CT of the mesenteric vasculature: normal anatomy, anatomic variants, and pathologic conditions. Radiographics. 2002;22(1):161–172. - PubMed
    1. Horton K M, Fishman E K. The current status of multidetector row CT and three-dimensional imaging of the small bowel. Radiol Clin North Am. 2003;41(2):199–212. - PubMed
    1. Raptopoulos V, Davis M A, Davidoff A, et al. Fat-density oral contrast agent for abdominal CT. Radiology. 1987;164(3):653–656. - PubMed
    1. Angelelli G, Macarini L, Fratello A. Use of water as an oral contrast agent for CT study of the stomach. AJR Am J Roentgenol. 1987;149(5):1084. [letter] - PubMed