

Human cancer protein-protein interaction network: a structural perspective
- PMID: 20011507
- PMCID: PMC2785480
- DOI: 10.1371/journal.pcbi.1000601
Human cancer protein-protein interaction network: a structural perspective
Abstract
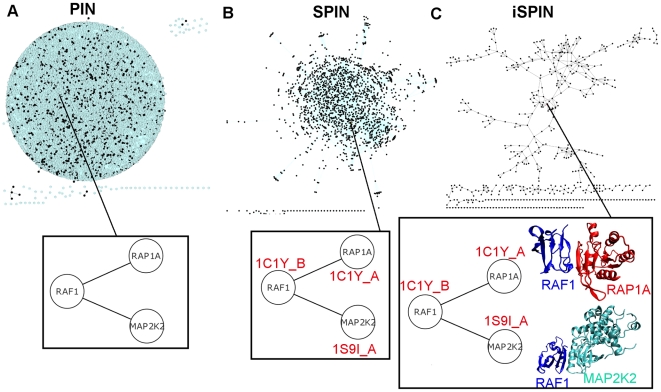
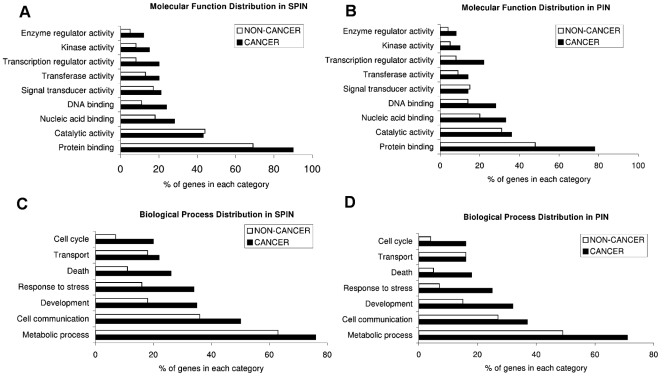
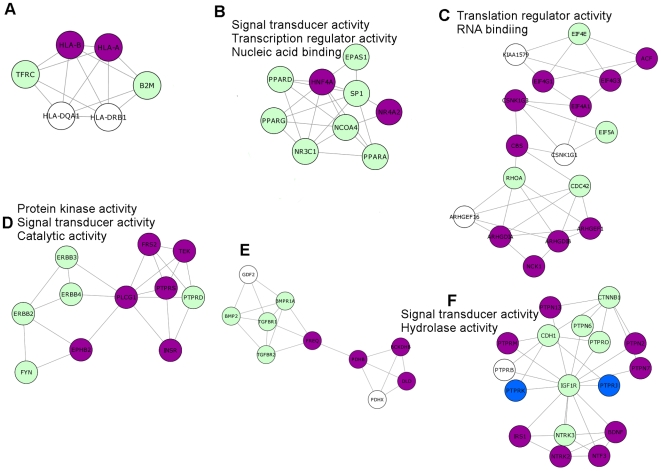
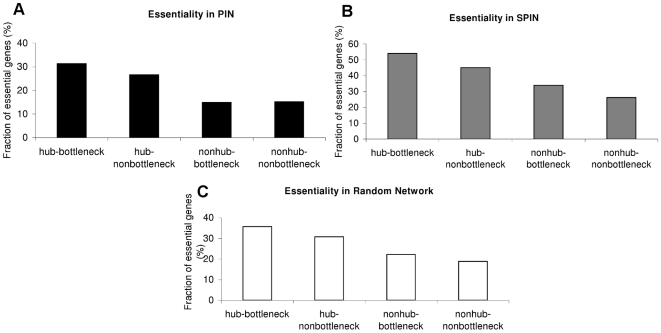
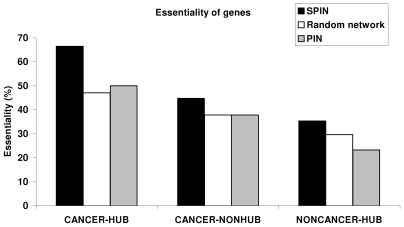
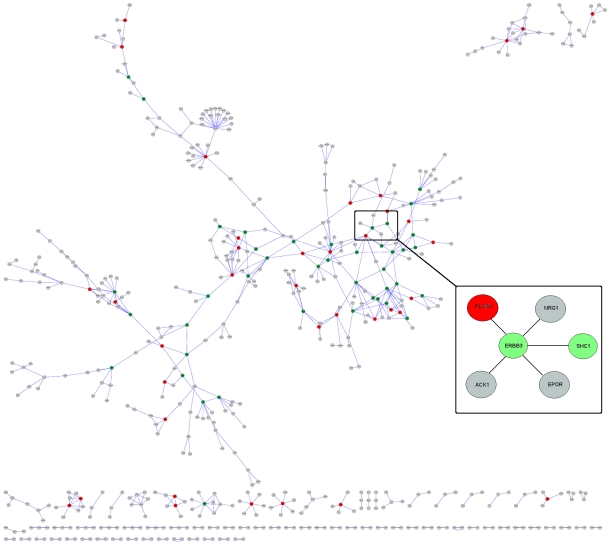
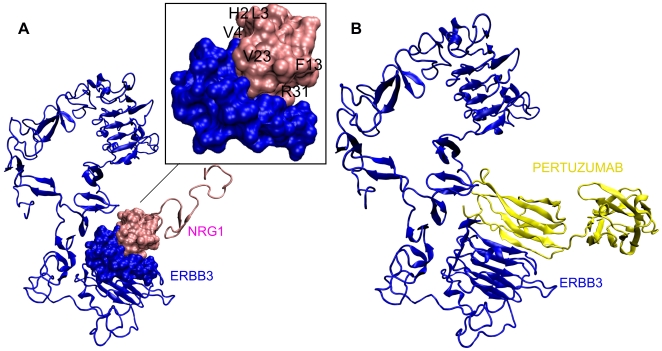
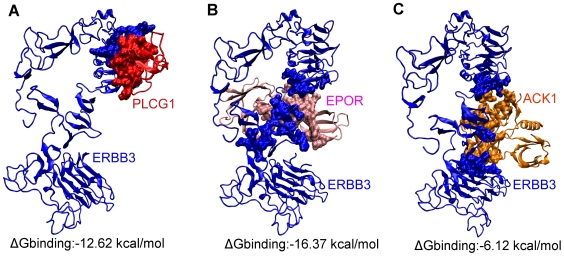
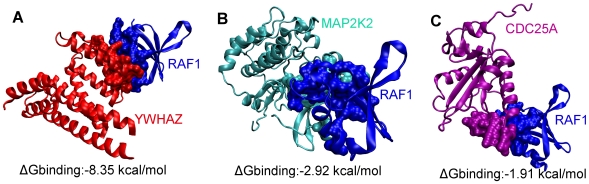
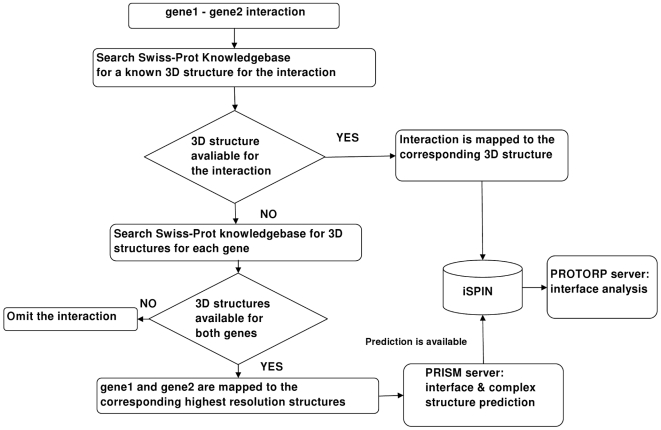
Protein-protein interaction networks provide a global picture of cellular function and biological processes. Some proteins act as hub proteins, highly connected to others, whereas some others have few interactions. The dysfunction of some interactions causes many diseases, including cancer. Proteins interact through their interfaces. Therefore, studying the interface properties of cancer-related proteins will help explain their role in the interaction networks. Similar or overlapping binding sites should be used repeatedly in single interface hub proteins, making them promiscuous. Alternatively, multi-interface hub proteins make use of several distinct binding sites to bind to different partners. We propose a methodology to integrate protein interfaces into cancer interaction networks (ciSPIN, cancer structural protein interface network). The interactions in the human protein interaction network are replaced by interfaces, coming from either known or predicted complexes. We provide a detailed analysis of cancer related human protein-protein interfaces and the topological properties of the cancer network. The results reveal that cancer-related proteins have smaller, more planar, more charged and less hydrophobic binding sites than non-cancer proteins, which may indicate low affinity and high specificity of the cancer-related interactions. We also classified the genes in ciSPIN according to phenotypes. Within phenotypes, for breast cancer, colorectal cancer and leukemia, interface properties were found to be discriminating from non-cancer interfaces with an accuracy of 71%, 67%, 61%, respectively. In addition, cancer-related proteins tend to interact with their partners through distinct interfaces, corresponding mostly to multi-interface hubs, which comprise 56% of cancer-related proteins, and constituting the nodes with higher essentiality in the network (76%). We illustrate the interface related affinity properties of two cancer-related hub proteins: Erbb3, a multi interface, and Raf1, a single interface hub. The results reveal that affinity of interactions of the multi-interface hub tends to be higher than that of the single-interface hub. These findings might be important in obtaining new targets in cancer as well as finding the details of specific binding regions of putative cancer drug candidates.
Conflict of interest statement
The authors have declared that no competing interests exist.
Figures
Similar articles
-
Oligomeric protein structure networks: insights into protein-protein interactions.BMC Bioinformatics. 2005 Dec 10;6:296. doi: 10.1186/1471-2105-6-296. BMC Bioinformatics. 2005. PMID: 16336694 Free PMC article.
-
Analysis of hot region organization in hub proteins.Ann Biomed Eng. 2010 Jun;38(6):2068-78. doi: 10.1007/s10439-010-0048-9. Epub 2010 May 1. Ann Biomed Eng. 2010. PMID: 20437205
-
Distinct roles of overlapping and non-overlapping regions of hub protein interfaces in recognition of multiple partners.J Mol Biol. 2011 Aug 19;411(3):713-27. doi: 10.1016/j.jmb.2011.06.027. Epub 2011 Jun 22. J Mol Biol. 2011. PMID: 21723293
-
Topological properties of protein interaction networks from a structural perspective.Biochem Soc Trans. 2008 Dec;36(Pt 6):1398-403. doi: 10.1042/BST0361398. Biochem Soc Trans. 2008. PMID: 19021563 Free PMC article. Review.
-
Prediction of protein-protein interactions: unifying evolution and structure at protein interfaces.Phys Biol. 2011 Jun;8(3):035006. doi: 10.1088/1478-3975/8/3/035006. Epub 2011 May 13. Phys Biol. 2011. PMID: 21572173 Review.
Cited by
-
Prevalent Accumulation of Non-Optimal Codons through Somatic Mutations in Human Cancers.PLoS One. 2016 Aug 11;11(8):e0160463. doi: 10.1371/journal.pone.0160463. eCollection 2016. PLoS One. 2016. PMID: 27513638 Free PMC article.
-
Identification of novel interacts partners of ADAR1 enzyme mediating the oncogenic process in aggressive breast cancer.Sci Rep. 2023 May 23;13(1):8341. doi: 10.1038/s41598-023-35517-6. Sci Rep. 2023. PMID: 37221310 Free PMC article.
-
Cancer/testis antigens as molecular drug targets using network pharmacology.Tumour Biol. 2016 Dec;37:15697–15705. doi: 10.1007/s13277-016-5333-2. Epub 2016 Oct 5. Tumour Biol. 2016. PMID: 27709548
-
Network spectra for drug-target identification in complex diseases: new guns against old foes.Appl Netw Sci. 2018;3(1):51. doi: 10.1007/s41109-018-0107-y. Epub 2018 Dec 17. Appl Netw Sci. 2018. PMID: 30596144 Free PMC article. Review.
-
Long noncoding RNAs with peptide-encoding potential identified in esophageal squamous cell carcinoma: KDM4A-AS1-encoded peptide weakens cancer cell viability and migratory capacity.Mol Oncol. 2023 Jul;17(7):1419-1436. doi: 10.1002/1878-0261.13424. Epub 2023 Apr 10. Mol Oncol. 2023. PMID: 36965032 Free PMC article.
References
-
- Kann MG. Protein interactions and disease: computational approaches to uncover the etiology of diseases. Brief Bioinform. 2007;8:333–346. - PubMed
Publication types
MeSH terms
Substances
LinkOut - more resources
Full Text Sources
Research Materials
Miscellaneous
