. 2009 Dec 14;4(12):e8311.
doi: 10.1371/journal.pone.0008311.

Bi-directional SIFT predicts a subset of activating mutations

Affiliations

Bi-directional SIFT predicts a subset of activating mutations

William Lee et al. PLoS One. .

Abstract

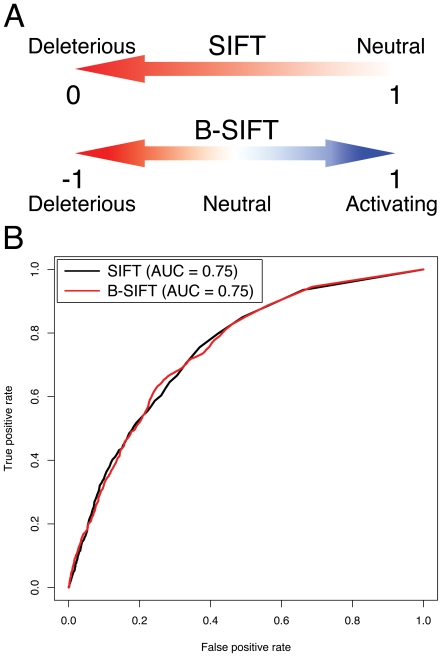
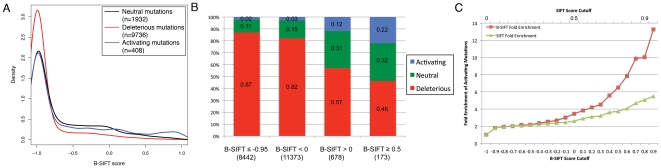
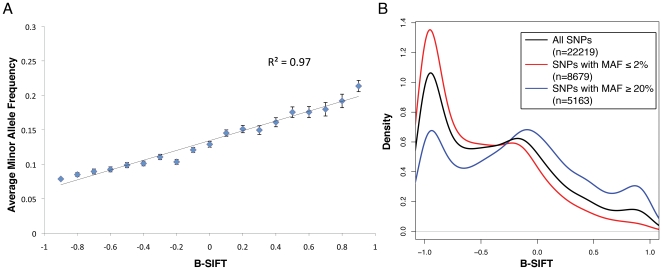
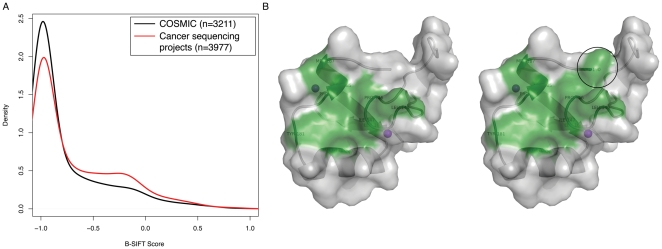
Advancements in sequencing technologies have empowered recent efforts to identify polymorphisms and mutations on a global scale. The large number of variations and mutations found in these projects requires high-throughput tools to identify those that are most likely to have an impact on function. Numerous computational tools exist for predicting which mutations are likely to be functional, but none that specifically attempt to identify mutations that result in hyperactivation or gain-of-function. Here we present a modified version of the SIFT (Sorting Intolerant from Tolerant) algorithm that utilizes protein sequence alignments with homologous sequences to identify functional mutations based on evolutionary fitness. We show that this bi-directional SIFT (B-SIFT) is capable of identifying experimentally verified activating mutants from multiple datasets. B-SIFT analysis of large-scale cancer genotyping data identified potential activating mutations, some of which we have provided detailed structural evidence to support. B-SIFT could prove to be a valuable tool for efforts in protein engineering as well as in identification of functional mutations in cancer.


Conflict of interest statement

Competing Interests: The authors are employees of Genentech, Inc.

Figures

Figure 1
Figure 1. B-SIFT schematic and performance compared to SIFT.
A. Schematic of B-SIFT scoring range versus original SIFT. SIFT generates scores for each substitution on a scale from 0 to 1, with scores closer to zero representing the mutations most likely to be deleterious. B-SIFT is bi-directional and takes the difference of SIFT scores between the wild-type and mutant alleles to obtain a score ranging from −1 to 1 with higher scores representing substitutions more likely to be activating mutations. B. Performance of B-SIFT versus SIFT in predicting deleterious mutations. A receiver-operator characteristic (ROC) plot showing the true positive versus false positive performance rates for B-SIFT (red curve, area under curve = 0.75) and SIFT (black curve, area under curve = 0.75) in predicting which of 4041 mutants of the E. coli LacI repressor gene are likely to have a deleterious functional impact , .
Figure 2
Figure 2. Validation of B-SIFT on protein mutation datasets.
A. Distribution of B-SIFT scores for SWISS-PROT mutagenesis data. Density plots showing the distributions of B-SIFT scores for mutations in the SWISS-PROT mutagenesis dataset classified as deleterious (red curve), neutral (black), and activating (blue). Legend specifies the number of mutations classified under each functional category. B. Mutation composition of SWISS-PROT mutagenesis data. Each bar shows the percentage of the total mutations that meet the given B-SIFT cutoffs that are classified as either activating (blue), neutral (green), or deleterious (red). Values in parentheses show the total number of mutations that met each of the B-SIFT score thresholds. C. Fold enrichment of activating mutations with increasing score cutoffs. As B-SIFT score cutoff is increased, the percentage of activating mutations with B-SIFT scores greater than or equal to the cutoff increases as well (red line). A B-SIFT cutoff of −1 represents the complete dataset and each successive point is the fold enrichment over this baseline. In contrast, the green line shows a similar plot but using increasing SIFT cutoffs starting from 0. Although simply having a high SIFT score also results in enrichment of activating mutations, B-SIFT significantly improves the enrichment.
Figure 3
Figure 3. B-SIFT analysis of naturally occurring variations in dbSNP.
A. Average minor allele frequency is correlated with B-SIFT score in dbSNP. Scatter plot and linear trendline showing that as B-SIFT score increases, the average minor allele frequency (MAF) for bi-allelic SNPs within each B-SIFT score range also increases, linear regression r2 = 0.97, error bars represent the standard error of the mean at each point. B. Distribution of B-SIFT scores in dbSNP. Density plots showing the distributions of B-SIFT scores for all bi-allelic polymorphisms in dbSNP (black curve), those with minor allele frequency (MAF) less than or equal to 2% (red), and those with MAF> = 20% (blue). The legend shows the number of SNPs included in each of the distribution curves.
Figure 4
Figure 4. B-SIFT and structural analysis of potential activating cancer somatic mutations.
A. Distribution of B-SIFT scores in cancer somatic mutation datasets. Density plots showing the distributions of B-SIFT scores for somatic missense mutations listed in COSMIC (black curve) , and those found in large-scale cancer sequencing projects representing a large set of cancers including pancreatic, breast, colorectal cancers, lung adenocarcinoma, and glioblastoma (red) , , , , . B. Model of Pirh2 interaction surface. Models of Pirh2 at the UbcH2 binding interface, green shading represents the hydrophobic surface important in the protein-protein interaction. The left model is for wild-type Pirh2 and the model on the right shows the increased hydrophobic surface that would result from the A190V mutation, the black circle highlights the change.

Similar articles

Cited by

References

    1. Kaminker JS, Zhang Y, Watanabe C, Zhang Z. CanPredict: a computational tool for predicting cancer-associated missense mutations. Nucleic Acids Res. 2007;35:W595–598. - PMC - PubMed
    1. Karchin R, Diekhans M, Kelly L, Thomas DJ, Pieper U, et al. LS-SNP: large-scale annotation of coding non-synonymous SNPs based on multiple information sources. Bioinformatics. 2005;21:2814–2820. - PubMed
    1. Ng PC, Henikoff S. Accounting for human polymorphisms predicted to affect protein function. Genome Res. 2002;12:436–446. - PMC - PubMed
    1. Sunyaev S, Ramensky V, Koch I, Lathe W, 3rd, Kondrashov AS, et al. Prediction of deleterious human alleles. Hum Mol Genet. 2001;10:591–597. - PubMed
    1. Yue P, Li Z, Moult J. Loss of protein structure stability as a major causative factor in monogenic disease. J Mol Biol. 2005;353:459–473. - PubMed

Publication types