. 2009 Dec 14;4(12):e8298.
doi: 10.1371/journal.pone.0008298.

RNA-interference knockdown of Drosophila pigment dispersing factor in neuronal subsets: the anatomical basis of a neuropeptide's circadian functions

Affiliations

RNA-interference knockdown of Drosophila pigment dispersing factor in neuronal subsets: the anatomical basis of a neuropeptide's circadian functions

Orie T Shafer et al. PLoS One. .

Abstract

Background: In animals, neuropeptide signaling is an important component of circadian timekeeping. The neuropeptide pigment dispersing factor (PDF) is required for several aspects of circadian activity rhythms in Drosophila.

Methodology/principal findings: Here we investigate the anatomical basis for PDF's various circadian functions by targeted PDF RNA-interference in specific classes of Drosophila neuron. We demonstrate that PDF is required in the ventro-lateral neurons (vLNs) of the central brain and not in the abdominal ganglion for normal activity rhythms. Differential knockdown of PDF in the large or small vLNs indicates that PDF from the small vLNs is likely responsible for the maintenance of free-running activity rhythms and that PDF is not required in the large vLNs for normal behavior. PDF's role in setting the period of free-running activity rhythms and the proper timing of evening activity under light:dark cycles emanates from both subtypes of vLN, since PDF in either class of vLN was sufficient for these aspects of behavior.

Conclusions/significance: These results reveal the neuroanatomical basis PDF's various circadian functions and refine our understanding of the clock neuron circuitry of Drosophila.


Conflict of interest statement

Competing Interests: The authors have declared that no competing interests exist.

Figures

Figure 1
Figure 1. The effects of the Pdf01 mutation on PDF expression and the daily pattern of locomotion under LD 12∶12.
A. PDF expression in a wild-type (w33) CNS. PDF is shown in green, ELAV is shown in blue. cb  =  central brain, ol  =  optic lobe, Th  =  Thoracic ganglion, Ab  =  abdominal ganglion, scale bar  = 50 microns. B. The same PDF staining for a Pdf01 (w15) mutant CNS. No PDF IR is detectable (Renn et al. 1999). C. Representative confocal optical sections through single l- and s-vLNs from w33 and w15 brains. PER immunostaining is shown in green, PDF in magenta. Scale bar  = 10 microns. D. Quantification of PDF-IR in the l- and s-vLNs from w33 and w15 brains. Values are based on optical sections of 4 vLNs from 5 brains for each genotype. A student's t-test revealed a significant difference in l- and s-vLN PDF IR between genotypes (p<0.0001). E. Comparison of morning anticipation phase score between w33 and w15 flies under LD 12∶12. A Student's t-test revealed a significant difference between genotypes (p<0.0001). F. Summary of evening activity expressed as mean beam crossings per 30 minute bin during the last six hours of the day under LD 12∶12 for w15 mutants and w33 controls. w15 flies displayed higher locomotor activity in the hours leading up to lights-off. This was reflected in a significantly advanced peak of evening activity relative to w33 controls (Table 1).
Figure 2
Figure 2. Differential expression of various Gal4 elements among the four classes of persistent adult PDF neurons.
The Gal4 lines used are indicated above each column and in all cases drove uas-lacZnls expression. Neuron type is indicated on the left. Each panel is a single confocal optical section through an individual PDF neuron; anti-PDF IR is shown in green, anti-beta-galactosidase is shown in magenta. Both R6-Gal4 and Mai179-Gal4 were predominately expressed in the s-vLNs, but were often weakly expressed in one or two l-vLNs, as indicated by the numbers in the top row of optical sections.
Figure 3
Figure 3. tim-gal4-driven uas-Dcr2 and uas-PDFrnai expression knocks-down PDF specifically in the vLNs.
A. PDF expression in a y w,uas-Dcr2/y;tim-Gal4/+ CNS. PDF is shown in green, ELAV is shown in blue. cb  =  central brain, ol  =  optic lobe, Th  =  Thoracic ganglion, Ab  =  abdominal ganglon, scale bar  = 50 microns. B. PDF expression in a y w,uas-Dcr2/y;tim-Gal4/+;uas-PDFrnai/+ CNS. These flies lacked PDF expression in the central brain, but retained abdominal PDF expression (indicated by asterisk). C. Confocal Z-series of PDF IR in the posterior optic tract (pot) and dorsal projection (dp) of the vLNs in a y w,uas-Dcr2/y;tim-gal4/+; brain. PDF is shown in green and ELAV in blue. Scale bar  = 50 microns. D. An equivalent Z-series for a y w,uas-Dcr2;tim-Gal4/+;uas-PDFrnai/+ brain. Both projections lack PDF IR in these flies. E. Single, representative confocal optical sections through the l- and s-vLNs of tim-Gal4/+, y w,uas-Dcr2/y;tim-Gal4/+, y w,uas-Dcr2/y;;uas-PDFrnai/+, and y w,uas-Dcr2/y;tim-Gal4/+;uas-PDFrnai/+ brains. PER immunostaining is shown in green, PDF in magenta. The l- and s-vLNs of y w,uas-Dcr2/y;tim-Gal4/+;uas-PDFrnai/+ brains lacked somatic PDF IR. Scale-bar  = 10 microns. F and G. Quantification of PDF IR in the large (F) and small (G), vLNs from the genotypes shown in E. The presence or absence of the various Gal4/uas elements is indicated below the graphs. Values are based on optical sections of 4 vLNs from 5 brains for each genotype. ANOVA revealed a significant difference in somatic PDF IR for both the l- and s-vLNs among these genotypes (p<0.0001 for both cell types). A Tukey's multiple comparison test revealed that y w, uas-Dcr2;tim-Gal4/+;uas-PDFrnai/+ flies had significantly lower PDF-IR in the vLNs than all other genotypes (p<0.01) for all pair-wise comparisons for both the l- and s-vLNs. The y w, uas-Dcr2;;uas-PDFrnai/+ flies also displayed PDF-IR that was significantly lower than the y w, uas-Dcr2;;uas-PDFrnai controls in both the l- and s-vLNs (p<0.01 for all pair-wise comparisons.
Figure 4
Figure 4. RNAi knockdown of PDF in the l- and s-vLNs recapitulates Pdf01's LD phenotypes.
A. Comparison of morning anticipation phase score between uas-Dicer2;tim-gal4/+;uas-PDFrnai/+ flies and controls under LD 12∶12. ANOVA revealed a significant difference between genotypes (p<0.001) and a Tukey's multiple comparison test revealed significant differences between uas-Dicer2;tim-gal4/+;uas-PDFrnai/+and both controls with no significant difference between controls. B. Summary of evening activity expressed as mean beam crossings per 30 minute bin during the last six hours of the day under LD 12∶12 for uas-Dicer2;tim-gal4/+;uas-PDFrnai/+ flies and controls. uas-Dicer2;tim-gal4/+;uas-PDFrnai/+ flies displayed increased locomotor activity in the hours leading up to lights-off. This was reflected in a significantly advanced peak of evening activity relative to controls (Table 2).
Figure 5
Figure 5. dot-Gal4-driven uas-Dcr2 and uas-PDFrnai expression knocks-down abdominal PDF but does not effect vLN PDF levels.
A. PDF expression in a y w,uas-Dcr2/y;dot-Gal4/+ CNS. PDF is shown in green, ELAV is shown in blue. cb  =  central brain, ol  =  optic lobe, Th  =  Thoracic ganglion, Ab  =  abdominal ganglion, scale bar  = 50 microns. B. PDF expression in a y w,uas-Dcr2/y;dot-Gal4/+;uas-PDFrnai/+ CNS. These lacked PDF expression in the abdominal ganglion as indicated by the asterisk. This is shown at higher resolution in Supplemental Figure S4. These flies retained PDF expression in the brain. C. Confocal Z-series of PDF IR in the posterior optic tract (pot) and dorsal projection (dp) of the vLNs in a y w,uas-Dcr2/y;dot-gal4/+; brain. PDF is shown in green and ELAV in blue. Scale bar  = 50 microns. D. An equivalent Z-series for a y w,uas-Dcr2;dot-Gal4/+;uas-PDFrnai/+ brain showing normal PDF expression in these projections. E. Single, representative confocal optical sections through a l- and s-vLN from y w,uas-Dcr2/y;dot-Gal4/+ and y w,uas-Dcr2/y;dot-Gal4/+;uas-PDFrnai/+ brains. PER immunostaining is shown in green, PDF in magenta. Both genotypes showed clear somatic PDF IR in both vLN subtypes. Scale-bar  = 10 microns. F and G. Quantification of PDF IR in the large (F) and small (G), vLNs from the genotypes shown in E. The presence or absence of the various Gal4/uas elements is indicated on the graphs. Values are based on optical sections of 4 vLNs from 5 brains for each genotype. ANOVA revealed no significant difference in somatic PDF IR for either the l- and s-vLNs between these genotypes (p = 0.206 for the l-vLNs; p = 0.063 for s-vLNs).
Figure 6
Figure 6. RNAi knockdown of PDF in the l- and s-Ab cells has no Pdf01-like effects on locomotor behavior under LD.
A. Comparison of morning anticipation phase score between uas-Dicer2;Dot-gal4/+;uas-PDFrnai/+ flies and controls under LD 12∶12. ANOVA revealed significant differences between genotypes (p = 0.0107) with uas-Dicer2;Dot-gal4/+;uas-PDFrnai/+ flies displaying a higher score compared to controls, but a Tukey's multiple comparison test revealed no significant difference between uas-Dicer2;Dot-gal4/+;uas-PDFrnai/+and the uas-Dicer2;Dot-Gal4/+ control. B. Summary of evening activity expressed as mean beam crossings per 30 minute bin during the last six hours of the day under LD 12∶12 for uas-Dicer2;Dot-gal4/+;uas-PDFrnai/+ flies and controls. uas-Dicer2;Dot-gal4/+;uas-PDFrnai/+ flies displayed no Pdf01-like increases in locomotor activity in the hours leading up to lights-off and there was no correlation between evening peak phase and PDF levels within the Ab PDF neurons (Table 3).
Figure 7
Figure 7. c929-gal4-driven uas-Dcr2 and uas-PDFrnai expression results in a knockdown of l-vLN PDF and increased PDF IR in the s-vLNs.
A. PDF expression in a y w,uas-Dcr2/y;c929-Gal4/+ CNS. PDF is shown in green, ELAV is shown in blue. cb  =  central brain, ol  =  optic lobe, Th  =  Thoracic ganglion, Ab  =  abdominal ganglion, scale bar  = 50 microns. B. PDF expression in a y w,uas-Dcr2/y;c929-Gal4/+;uas-PDFrnai/+ CNS. These lacked PDF expression in the l-vLN soma and optic lobe projections, but retained s-vLN and l-Ab PDF expression. Most CNSs of this genotype lacked PDF IR in the s-Ab neurons (Supplemental Figure S4). C. Confocal Z-series of PDF IR in the posterior optic tract (pot) and dorsal projection (dp) of the vLNs in a y w,uas-Dcr2/y;c929-gal4/+ brain. PDF is shown in green and ELAV in blue. Scale bar  = 50 microns. D. An equivalent Z-series for a y w,uas-Dcr2;c929-Gal4/+;uas-PDFrnai/+ brain. PDF IR is not detectable in the pot of these flies but is retained in the dp. E. Single, representative confocal optical sections through a l- and s-vLN from y w,uas-Dcr2/y;c929-Gal4/+ and y w,uas-Dcr2/y;c929-Gal4/+;uas-PDFrnai/+ brains. PER immunostaining is shown in green, PDF in magenta. The l-vLNs of the latter genotype lacked PDF IR. PDF IR was apparent in the s-vLNs of both genotypes. Scale-bar  = 10microns. F and G. Quantification of PDF IR in the large (F) and small (G), vLNs from the genotypes shown in E. The presence or absence of the various Gal4/uas elements is indicated on the graphs. Values are based on optical sections of 4 vLNs from 5 brains for each genotype. A Student's T-test revealed significantly lower PDF IR in the l- vLNs of y w,uas-Dcr2/y;c929-Gal4/+;uas-PDFrnai/+ brains (p<0.0001). This genotype also showed significantly higher PDF IR in the s-vLNs (p<0.0001).
Figure 8
Figure 8. RNAi knockdown of PDF in the l-vLNs has no Pdf01-like effects on locomotor behavior under LD.
A. Comparison of morning anticipation phase score between uas-Dicer2;c929-gal4/+;uas-PDFrnai/+ flies and controls under LD 12∶12. ANOVA revealed no significant differences between genotypes (p = 0.58). B. Summary of evening activity expressed as mean beam crossings per 30 minute bin during the last six hours of the day under LD 12∶12 for uas-Dicer2;c929-gal4/+;uas-PDFrnai/+ flies and controls. uas-Dicer2;c929-gal4/+;uas-PDFrnai/+ flies displayed no Pdf01-like increases in locomotor activity in the hours leading up to lights-off and here was no significant effect of PDF loss from the l-vLNs on the evening peak phase (Table 4).
Figure 9
Figure 9. R6-Gal4-driven uas-Dcr2 and uas-PDFrnai expression results in partial PDF-knockdown specifically in the s- vLNs and does not effect PDF levels in the l-vLNs.
A. PDF expression in a y w,uas-Dcr2/y;R6-Gal4/+ CNS. PDF is shown in green, ELAV is shown in blue. cb  =  central brain, ol  =  optic lobe, Th  =  Thoracic ganglion, Ab  =  abdominal ganglion, scale bar  = 50 microns. B. PDF expression in a y w,uas-Dcr2/y;R6-Gal4/+;uas-PDFrnai/+ CNS. At this magnification PDF expression looks normal for all PDF neuron classes. C. Confocal Z-series of PDF IR in the posterior optic tract (pot) and dorsal projection (dp) of the vLNs in a y w,uas-Dcr2/y;R6-gal4/+ brain. PDF is shown in green and ELAV in blue. Scale bar  = 50 microns. D. An equivalent Z-series for a y w,uas-Dcr2;R6-Gal4/+;uas-PDFrnai/+ brain. PDF IR is present in both the dp and pot of these flies. E. Single, representative confocal optical sections through the l- and s-vLNs of y w,uas-Dcr2/y;R6-Gal4/+ and y w,uas-Dcr2/y;R6-Gal4/+;uas-PDFrnai/+ brains. PER immunostaining is shown in green, PDF in magenta. The s-vLNs of the latter genotype had relatively low somatic PDF IR. F and G. Quantification of PDF IR in the large (F) and small (G) vLNs from the genotypes shown in E. The presence or absence of the various Gal4/uas elements is indicated on the graphs. Values are based on optical sections of 4 vLNs from 5 brains for each genotype. Student's T-test revealed a significantly lower PDF IR in the s-vLNs of y w,uas-Dcr2/y;R6-Gal4/+;uas-PDFrnai/+ brains (p<0.0001), but no significant difference in l-vLN PDF IR (p = 0.8365).
Figure 10
Figure 10. Partial RNAi knockdown of PDF in the s-vLNs results in a reduction in morning anticipation, but normal evening locomotor behavior.
A. Comparison of morning anticipation phase score between uas-Dicer2;R6-gal4/+;uas-PDFrnai/+ flies and controls under LD 12∶12. ANOVA revealed significant differences between genotypes (p = 0.002) and a Tukey's multiple comparison test revealed significant differences between uas-Dicer2;R6-gal4/+;uas-PDFrnai/+ flies and both controls (p<0.05 for both pairwise comparisons) with no significant difference between the two control lines (p>0.05). B. Summary of evening activity expressed as mean beam crossings per 30 minute bin during the last six hours of the day under LD 12∶12 for uas-Dicer2;R6-gal4/+;uas-PDFrnai/+ flies and controls. uas-Dicer2;R6-gal4/+;uas-PDFrnai/+ flies did not display a Pdf01-like increase in locomotor activity in the hours leading up to lights-off relative to controls. R6-mediated reduction of PDF levels in the s-vLNs was associated with a later evening peak phase relative to uas-Dicer2;R6-gal4/+; and uas-Dicer2;;uas-PDFrnai/+ controls, but was not significantly different from; R6-Gal4/+; controls (Table 5).
Figure 11
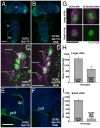
Figure 11. Mai179-Gal4-driven uas-Dcr2 and uas-PDFrnai knocks down PDF in the s- vLNs and a subset of the l-vLNs.
A. PDF expression in a y w,uas-Dcr2/y;Mai179-Gal4/+ CNS. PDF is shown in green, ELAV is shown in blue. cb  =  central brain, ol  =  optic lobe, Th  =  Thoracic ganglion, Ab  =  abdominal ganglion, scale bar  = 50 microns. B. PDF expression in a y w,uas-Dcr2/y;Mai179-Gal4/+;uas-PDFrnai/+ CNS. Only l-vLN and abdominal PDF expression was apparent in this genotype. C. Confocal Z-series through the vLNs of a y w,uas-Dcr2/y;Mai179-Gal4/+brain double labled for PDF (green) and PER (magenta). PDF IR is detectable in four l- and four s-vLNs. The PDF-negative 5th s-vLN is also labeled. D. An equivalent Z-series through the vLNs of a Dcr2/y;Mai179-Gal4/+;uas-PDFrnai/+ brain. These brains showed no somatic PDF IR in the s-vLNs and often contained a single l-vLN with extremely low somatic PDF IR. One such l-vLN is indicated by an asterisk. Scale Bar  = 20 microns. E. Confocal Z-series of PDF IR in the posterior optic tract (pot) and dorsal projection (dp) of the vLNs in a y w,uas-Dcr2/y;Mai179-gal4/+ brain. PDF is shown in green and ELAV in blue. Scale bar  = 50 microns. F. An equivalent Z-series for a y w,uas-Dcr2;Mai179-Gal4/+;uas-PDFrnai/+ brain. PDF IR is present in the pot but not the dp of these flies. G. Single, representative confocal optical sections through a l- and s-vLN from y w,uas-Dcr2/y;Mai179-Gal4/+ and y w,uas-Dcr2/y;Mai179-Gal4/+;uas-PDFrnai/+ brains. PER immunostaining is shown in green, PDF in magenta. The s-vLNs of the latter genotype displayed no obvious somatic PDF IR. Scale-bar  = 10 microns. H and I. Quantification of PDF IR in the large (H) and small (I), vLNs from the genotypes shown in G. The presence or absence of the various Gal4/uas elements is indicated on the graphs. Values are based on optical sections of 4 vLNs from 5 brains for each genotype. A Student's T-test revealed significantly lower PDF IR in the l-vLNs (p = 0.001) and s-vLNs (p<0.0001) of y w,uas-Dcr2/y;Mai-Gal4/+;uas-PDFrnai/+ brains.
Figure 12
Figure 12. Mai179-Gal4-mediated PDF knockdown in the s-vLNs and in a subset of the l-vLNs has only modest effects on locomotion under LD conditions.
A. Comparison of morning anticipation phase score between uas-Dicer2;Mai179-gal4/+;uas-PDFrnai/+ flies and controls under LD 12∶12. ANOVA revealed significant differences between genotypes (p = 0.0167), but a Tukey's multiple comparison test revealed significant differences between uas-Dicer2;Mai179-gal4/+;uas-PDFrnai/+ and uas-Dicer2;;uas-PDFrnai flies (p<0.05), but not between uas-Dicer2; Mai179-gal4/+;uas-PDFrnai/+ and uas-Dicer2; Mai179-gal4/+ (p>0.05). B. Summary of evening activity expressed as mean beam crossings per 30 minute bin during the last six hours of the day under LD 12∶12 for uas-Dicer2;Mai179-gal4/+;uas-PDFrnai/+ flies and controls. uas-Dicer2; Mai179-gal4/+;uas-PDFrnai/+ flies did not display a Pdf01-like increase in locomotor activity in the hours leading up to lights-off relative to controls and displayed a normal phase of evening peak activity relative to controls (Table 6).
Figure 13
Figure 13. A model of the circadian roles of PDF released from the l- and s-vLN within the clock neuron network.
PDF from either class of vLN appears to be sufficient for most of this peptide's circadian functions, though there is some evidence for specialized roles for PDF released from the s-vLNs. We hypothesize that PDF's roles in the maintenance of DD rhythmicity an in morning anticipation under LD emanate predominantly from the s-vLNs. PDF released from the l- or the s-vLNs appears to be sufficient to set τ and evening peak phase. PDF released from the l-vLNs is hypothesized to modulate PDF levels in the s-vLNs, a result consistent with previous work describing anatomical and physiological evidence of modulation of the s-vLNs by the l-vLNs , .

Similar articles

Cited by

References

    1. Dunlap JC. Molecular Bases for Circadian Clocks. Cell. 1999;96:271–290. - PubMed
    1. Herzog ED. Neurons and networks in daily rhythms. Nat Rev Neurosci. 2007;8:790–802. - PubMed
    1. Ralph M, Foster R, Davis F, Menaker M. Transplanted suprachiasmatic nucleus determines circadian period. Science. 1990;247:975–978. - PubMed
    1. Silver R, LeSauter J, Tresco PA, Lehman MN. A diffusible coupling signal from the transplanted suprachiasmatic nucleus controlling circadian locomotor rhythms. Nature. 1996;382:810–813. - PubMed
    1. Michel S, Geusz M, Zaritsky J, Block G. Circadian rhythm in membrane conductance expressed in isolated neurons. Science. 1993;259:239–241. - PubMed

Publication types

LinkOut - more resources