. 2009 Dec 14;4(12):e8306.
doi: 10.1371/journal.pone.0008306.

The extraction of depth structure from shading and texture in the macaque brain

Affiliations

The extraction of depth structure from shading and texture in the macaque brain

Koen Nelissen et al. PLoS One. .

Abstract

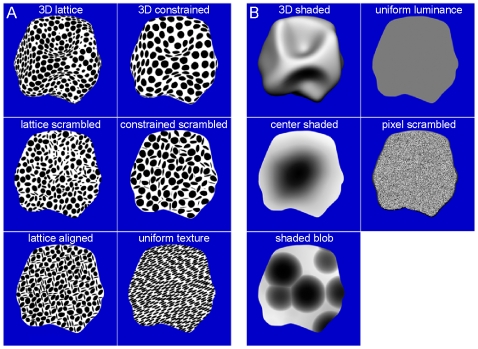
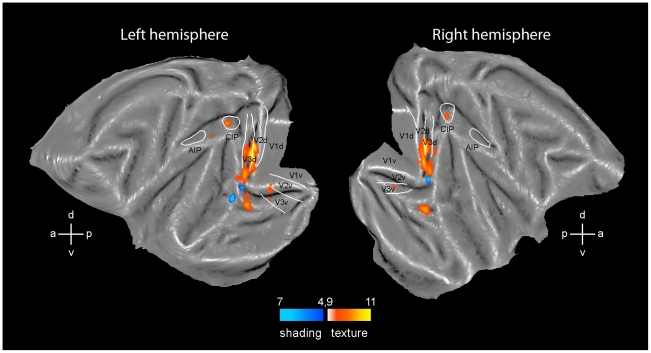
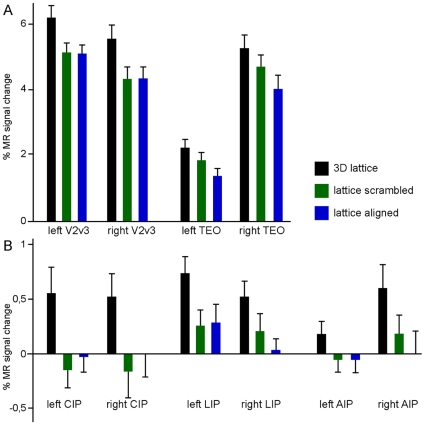
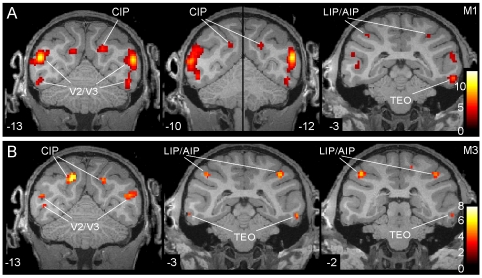
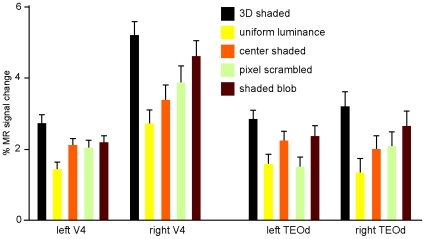
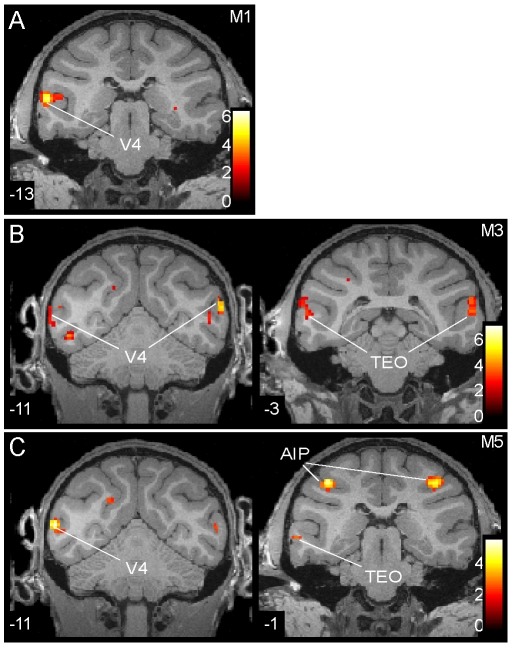
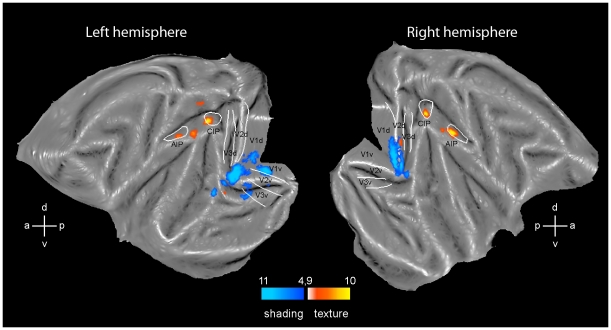
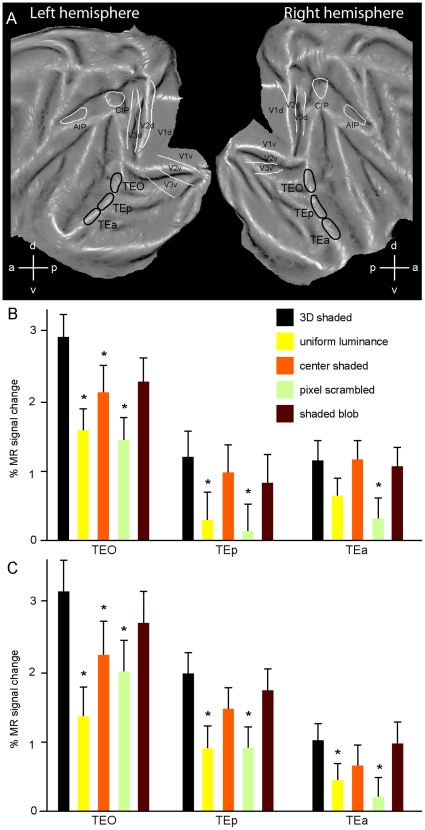
We used contrast-agent enhanced functional magnetic resonance imaging (fMRI) in the alert monkey to map the cortical regions involved in the extraction of 3D shape from the monocular static cues, texture and shading. As in the parallel human imaging study, we contrasted the 3D condition to several 2D control conditions. The extraction of 3D shape from texture (3D SfT) involves both ventral and parietal regions, in addition to early visual areas. Strongest activation was observed in CIP, with decreasing strength towards the anterior part of the intraparietal sulcus (IPS). In the ventral stream 3D SfT sensitivity was observed in a ventral portion of TEO. The extraction of 3D shape from shading (3D SfS) involved predominantly ventral regions, such as V4 and a dorsal potion of TEO. These results are similar to those obtained earlier in human subjects and indicate that the extraction of 3D shape from texture is performed in both ventral and dorsal regions for both species, as are the motion and disparity cues, whereas shading is mainly processed in the ventral stream.


Conflict of interest statement

Competing Interests: The authors have declared that no competing interests exist.

Figures

Figure 1
Figure 1. Visual stimuli.
(A) Texture stimuli, from top to bottom, left column: 3D lattice, lattice scrambled, and lattice aligned; right column: 3D constrained, constrained scrambled and uniform texture. (B) Shading stimuli, from top to bottom, left column: 3D shaded, center shaded, shaded blob; right column: uniform luminance, and pixel scrambled.
Figure 2
Figure 2. 3D SfT and 3D SfS sensitive regions.
Flatmaps of the left and right hemisphere of monkey template (M12) brain (Caret software) showing regions significant (fixed effects, p<0.05 corrected) in the conjunction of contrasts of the 3D SfT experiment (yellow to orange voxels, number of monkeys (n) = 2) and 3D SfS (blue voxels, n = 3) experiment. White lines indicate borders of V1-3 from Fize et al. and of CIP and AIP from Durand et al. . Color scales indicate t scores.
Figure 3
Figure 3. Activity profiles of regions involved in 3D SfT.
Percent signal change from fixation baselines is plotted as a function of condition for left and right V2/V3, (ventral) TEO, CIP, anterior LIP, and AIP. Note the decrease in specificity of the profile as one moves more anterior in the IPS (compare CIP and AIP).
Figure 4
Figure 4. Statistical parametric maps of regions involved in 3D SfT.
SPM t maps (single subject, p<0.001 uncorrected) from the conjunction of the two contrasts used in the 3D SfT experiment plotted onto coronal sections through the brains of M1 (A) and M3 (B). The middle panel in A is a composite of two coronal sections because the CIP activation reached maximum at slightly different anterior-posterior levels. Numbers indicate y coordinates, i.e. distances posterior from interaural plane.
Figure 5
Figure 5. Activity profiles of regions involved in 3D SfS.
Percent signal change from fixation baselines is plotted as a function of condition for left and right V4 and (dorsal) TEO.
Figure 6
Figure 6. Statistical parametric maps of regions involved in 3D SfS.
SPM t maps (single subject, p<0.001 uncorrected) from the conjunction of the four contrasts used in the 3D SfS experiment plotted onto coronal sections through the brains of M1 (A), M3 (B) and M5 (C).
Figure 7
Figure 7. Control analyses.
Flatmaps of the left and right hemisphere of monkey template (M12) brain (Caret software) showing regions significant (p<0.05 corrected) in the conjunction of two contrasts of the 3D SfS experiment (blue voxels, fixed effects, n = 3) and in four contrasts of the 3D SfT experiment (yellow to orange voxels, M3 single subject). Same conventions as in Figure 2.
Figure 8
Figure 8. Activity profiles of subdivisions of inferotemporal cortex.
A: definition of the 3 ROIs: TEO, posterior TE and anterior TE; B and C: activity profiles of the 3 ROIs of the left (B) and right (C) hemispheres (% MR signal change vs fixation baseline). Asterisks indicate conditions which differ significantly (p<0.05 one-way ANOVA followed by post hoc Bonferoni test) from 3D condition.

Similar articles

Cited by

References

    1. Georgieva SS, Todd JT, Peeters R, Orban GA. The extraction of 3D shape from texture and shading in the human brain. Cereb Cortex. 2008;18:2416–2438. - PMC - PubMed
    1. Todd JT. The visual perception of 3D shape. Trends Cogn Sci. 2004;8:115–121. - PubMed
    1. Zhang Y, Weiner VS, Slocum WM, Schiller PH. Depth from shading and disparity in humans and monkeys. Vis Neurosci. 2007;24:207–215. - PubMed
    1. Yamane Y, Carlson ET, Bowman KC, Wang Z, Connor CE. A neural code for three-dimensional object shape in macaque inferotemporal cortex. Nat Neurosci. 2008;11:1352–1360. - PMC - PubMed
    1. Taira M, Tsutsui KI, Jiang M, Yara K, Sakata H. Parietal neurons represent surface orientation from the gradient of binocular disparity. J Neurophysiol. 2000;83:3140–3146. - PubMed

Publication types