

Kinetic characterization and phosphoregulation of the Francisella tularensis 1-deoxy-D-xylulose 5-phosphate reductoisomerase (MEP synthase)
- PMID: 20011597
- PMCID: PMC2788227
- DOI: 10.1371/journal.pone.0008288
Kinetic characterization and phosphoregulation of the Francisella tularensis 1-deoxy-D-xylulose 5-phosphate reductoisomerase (MEP synthase)
Abstract
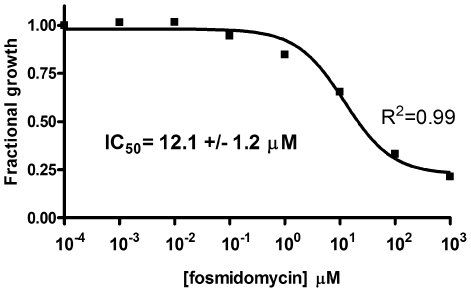
Deliberate and natural outbreaks of infectious disease underscore the necessity of effective vaccines and antimicrobial/antiviral therapeutics. The prevalence of antibiotic resistant strains and the ease by which antibiotic resistant bacteria can be intentionally engineered further highlights the need for continued development of novel antibiotics against new bacterial targets. Isoprenes are a class of molecules fundamentally involved in a variety of crucial biological functions. Mammalian cells utilize the mevalonic acid pathway for isoprene biosynthesis, whereas many bacteria utilize the methylerythritol phosphate (MEP) pathway, making the latter an attractive target for antibiotic development. In this report we describe the cloning and characterization of Francisella tularensis MEP synthase, a MEP pathway enzyme and potential target for antibiotic development. In vitro growth-inhibition assays using fosmidomycin, an inhibitor of MEP synthase, illustrates the effectiveness of MEP pathway inhibition with F. tularensis. To facilitate drug development, F. tularensis MEP synthase was cloned, expressed, purified, and characterized. Enzyme assays produced apparent kinetic constants (K(M)(DXP) = 104 microM, K(M)(NADPH) = 13 microM, k(cat)(DXP) = 2 s(-1), k(cat)(NADPH) = 1.3 s(-1)), an IC(50) for fosmidomycin of 247 nM, and a K(i) for fosmidomycin of 99 nM. The enzyme exhibits a preference for Mg(+2) as a divalent cation. Titanium dioxide chromatography-tandem mass spectrometry identified Ser177 as a site of phosphorylation. S177D and S177E site-directed mutants are inactive, suggesting a mechanism for post-translational control of metabolic flux through the F. tularensis MEP pathway. Overall, our study suggests that MEP synthase is an excellent target for the development of novel antibiotics against F. tularensis.
Conflict of interest statement
Figures


Similar articles
-
Francisella tularensis 2-C-methyl-D-erythritol 4-phosphate cytidylyltransferase: kinetic characterization and phosphoregulation.PLoS One. 2011;6(6):e20884. doi: 10.1371/journal.pone.0020884. Epub 2011 Jun 9. PLoS One. 2011. PMID: 21694781 Free PMC article.
-
Isolation of the dxr gene of Zymomonas mobilis and characterization of the 1-deoxy-D-xylulose 5-phosphate reductoisomerase.FEMS Microbiol Lett. 2000 Oct 1;191(1):131-7. doi: 10.1111/j.1574-6968.2000.tb09329.x. FEMS Microbiol Lett. 2000. PMID: 11004410
-
Kinetic and chemical mechanism of Mycobacterium tuberculosis 1-deoxy-D-xylulose-5-phosphate isomeroreductase.Biochemistry. 2004 Apr 13;43(14):4375-84. doi: 10.1021/bi049974k. Biochemistry. 2004. PMID: 15065882
-
1-Deoxy-D-xylulose 5-phosphate reductoisomerase: an overview.Bioorg Chem. 2004 Dec;32(6):483-93. doi: 10.1016/j.bioorg.2004.08.004. Bioorg Chem. 2004. PMID: 15530989 Review.
-
Mechanism and inhibition of 1-deoxy-D-xylulose-5-phosphate reductoisomerase.Bioorg Chem. 2014 Dec;57:171-185. doi: 10.1016/j.bioorg.2014.06.001. Epub 2014 Jun 19. Bioorg Chem. 2014. PMID: 24998420 Review.
Cited by
-
Kinetic characterization and allosteric inhibition of the Yersinia pestis 1-deoxy-D-xylulose 5-phosphate reductoisomerase (MEP synthase).PLoS One. 2014 Aug 29;9(8):e106243. doi: 10.1371/journal.pone.0106243. eCollection 2014. PLoS One. 2014. PMID: 25171339 Free PMC article.
-
Inhibition Studies on Enzymes Involved in Isoprenoid Biosynthesis: Focus on Two Potential Drug Targets: DXR and IDI-2 Enzymes.Curr Enzym Inhib. 2011 Jul;7(2):10.2174/157340811796575317. doi: 10.2174/157340811796575317. Curr Enzym Inhib. 2011. PMID: 24339799 Free PMC article.
-
Potentiation of the Fosmidomycin analogue FR 900098 with substituted 2-oxazolines against Francisella novicida.Medchemcomm. 2016;7(10):1952-1956. doi: 10.1039/C6MD00365F. Epub 2016 Jul 27. Medchemcomm. 2016. PMID: 28154750 Free PMC article.
-
Isoprenoid metabolism in apicomplexan parasites.Curr Clin Microbiol Rep. 2014 Dec 1;1(3-4):37-50. doi: 10.1007/s40588-014-0006-7. Curr Clin Microbiol Rep. 2014. PMID: 25893156 Free PMC article.
-
Mechanistic binding insights for 1-deoxy-D-Xylulose-5-Phosphate synthase, the enzyme catalyzing the first reaction of isoprenoid biosynthesis in the malaria-causing protists, Plasmodium falciparum and Plasmodium vivax.Protein Expr Purif. 2016 Apr;120:16-27. doi: 10.1016/j.pep.2015.12.003. Epub 2015 Dec 15. Protein Expr Purif. 2016. PMID: 26699947 Free PMC article.
References
-
- Singh N, Cheve G, Avery MA, McCurdy CR. Targeting the methyl erythritol phosphate (MEP) pathway for novel antimalarial, antibacterial and herbicidal drug discovery: inhibition of 1-deoxy-D-xylulose-5-phosphate reductoisomerase (DXR) enzyme. Curr Pharm Des. 2007;13:1161–1177. - PubMed
-
- Rohdich F, Bacher A, Eisenreich W. Isoprenoid biosynthetic pathways as anti-infective drug targets. Biochem Soc Trans. 2005;33:785–791. - PubMed
-
- Rohmer M. From molecular fossils of bacterial hopanoids to the formation of isoprene units: discovery and elucidation of the methylerythritol phosphate pathway. Lipids. 2008;43:1095–1107. - PubMed
-
- Koppisch AT, Fox DT, Blagg BS, Poulter CD. E. coli MEP synthase: steady-state kinetic analysis and substrate binding. Biochemistry. 2002;41:236–243. - PubMed
Publication types
MeSH terms
Substances
LinkOut - more resources
Full Text Sources
Other Literature Sources
Miscellaneous
