Cytoplasmic acidification and the benzoate transcriptome in Bacillus subtilis
- PMID: 20011599
- PMCID: PMC2788229
- DOI: 10.1371/journal.pone.0008255
Cytoplasmic acidification and the benzoate transcriptome in Bacillus subtilis
Abstract
Background: Bacillus subtilis encounters a wide range of environmental pH. The bacteria maintain cytoplasmic pH within a narrow range. Response to acid stress is a poorly understood function of external pH and of permeant acids that conduct protons into the cytoplasm.
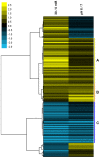
Methods and principal findings: Cytoplasmic acidification and the benzoate transcriptome were observed in Bacillus subtilis. Cytoplasmic pH was measured with 4-s time resolution using GFPmut3b fluorimetry. Rapid external acidification (pH 7.5 to 6.0) acidified the B. subtilis cytoplasm, followed by partial recovery. Benzoate addition up to 60 mM at external pH 7 depressed cytoplasmic pH but left a transmembrane Delta pH permitting growth; this robust adaptation to benzoate exceeds that seen in E. coli. Cytoplasmic pH was depressed by 0.3 units during growth with 30 mM benzoate. The transcriptome of benzoate-adapted cells was determined by comparing 4,095 gene expression indices following growth at pH 7, +/- 30 mM benzoate. 164 ORFs showed > or = 2-fold up-regulation by benzoate (30 mM benzoate/0 mM), and 102 ORFs showed > or = 2-fold down-regulation. 42% of benzoate-dependent genes are regulated up or down, respectively, at pH 6 versus pH 7; they are candidates for cytoplasmic pH response. Acid-stress genes up-regulated by benzoate included drug resistance genes (yhbI, yhcA, yuxJ, ywoGH); an oligopeptide transporter (opp); glycine catabolism (gcvPA-PB); acetate degradation (acsA); dehydrogenases (ald, fdhD, serA, yrhEFG, yjgCD); the TCA cycle (citZ, icd, mdh, sucD); and oxidative stress (OYE-family yqjM, ohrB). Base-stress genes down-regulated by benzoate included malate metabolism (maeN), sporulation control (spo0M, spo0E), and the SigW alkali shock regulon. Cytoplasmic pH could mediate alkali-shock induction of SigW.
Conclusions: B. subtilis maintains partial pH homeostasis during growth, and withstands high concentrations of permeant acid stress, higher than for gram-negative neutralophile E. coli. The benzoate adaptation transcriptome substantially overlaps that of external acid, contributing to a cytoplasmic pH transcriptome.
Conflict of interest statement
Figures


Similar articles
-
Acid and base stress and transcriptomic responses in Bacillus subtilis.Appl Environ Microbiol. 2009 Feb;75(4):981-90. doi: 10.1128/AEM.01652-08. Epub 2008 Dec 29. Appl Environ Microbiol. 2009. PMID: 19114526 Free PMC article.
-
Rapid acid treatment of Escherichia coli: transcriptomic response and recovery.BMC Microbiol. 2008 Feb 26;8:37. doi: 10.1186/1471-2180-8-37. BMC Microbiol. 2008. PMID: 18302792 Free PMC article.
-
pH of the cytoplasm and periplasm of Escherichia coli: rapid measurement by green fluorescent protein fluorimetry.J Bacteriol. 2007 Aug;189(15):5601-7. doi: 10.1128/JB.00615-07. Epub 2007 Jun 1. J Bacteriol. 2007. PMID: 17545292 Free PMC article.
-
Bacterial responses to alkaline stress.Sci Prog. 2003;86(Pt 4):271-82. doi: 10.3184/003685003783238635. Sci Prog. 2003. PMID: 15508893 Free PMC article. Review.
-
pH homeostasis and ATP synthesis: studies of two processes that necessitate inward proton translocation in extremely alkaliphilic Bacillus species.Extremophiles. 1998 Aug;2(3):217-22. doi: 10.1007/s007920050063. Extremophiles. 1998. PMID: 9783168 Review.
Cited by
-
Comparison of Escherichia coli surface attachment methods for single-cell microscopy.Sci Rep. 2019 Dec 19;9(1):19418. doi: 10.1038/s41598-019-55798-0. Sci Rep. 2019. PMID: 31857669 Free PMC article.
-
Disparate Effects of Two Clerodane Diterpenes of Giant Goldenrod (Solidago gigantea Ait.) on Bacillus spizizenii.Int J Mol Sci. 2024 Jan 26;25(3):1531. doi: 10.3390/ijms25031531. Int J Mol Sci. 2024. PMID: 38338810 Free PMC article.
-
Cytoplasmic pH response to acid stress in individual cells of Escherichia coli and Bacillus subtilis observed by fluorescence ratio imaging microscopy.Appl Environ Microbiol. 2012 May;78(10):3706-14. doi: 10.1128/AEM.00354-12. Epub 2012 Mar 16. Appl Environ Microbiol. 2012. PMID: 22427503 Free PMC article.
-
An oxalate decarboxylase-like cupin domain containing protein is involved in imparting acid stress tolerance in Bacillus amyloliquefaciens MBNC.World J Microbiol Biotechnol. 2024 Jan 8;40(2):64. doi: 10.1007/s11274-023-03870-3. World J Microbiol Biotechnol. 2024. PMID: 38189984
-
Single-cell, time-resolved study of the effects of the antimicrobial peptide alamethicin on Bacillus subtilis.Biochim Biophys Acta. 2016 Apr;1858(4):725-32. doi: 10.1016/j.bbamem.2016.01.003. Epub 2016 Jan 8. Biochim Biophys Acta. 2016. PMID: 26777771 Free PMC article.
References
-
- Slonczewski JL, Fujisawa M, Dopson M, Krulwich TA. Cytoplasmic pH measurement and homeostasis in bacteria and archaea. Adv Micro Physiol. 2009;55:1–79. - PubMed
Publication types
MeSH terms
Substances
Grants and funding
LinkOut - more resources
Full Text Sources
Molecular Biology Databases

