. 2009 Dec 14;4(12):e8245.
doi: 10.1371/journal.pone.0008245.

IgG autoantibody to brain beta tubulin III associated with cytokine cluster-II discriminate cerebral malaria in central India

Affiliations

IgG autoantibody to brain beta tubulin III associated with cytokine cluster-II discriminate cerebral malaria in central India

Devendra Bansal et al. PLoS One. .

Abstract

Background: The main processes in the pathogenesis of cerebral malaria caused by Plasmodium falciparum involved sequestration of parasitized red blood cells and immunopathological responses. Among immune factors, IgG autoantibodies to brain antigens are increased in P. falciparum infected patients and correlate with disease severity in African children. Nevertheless, their role in the pathophysiology of cerebral malaria (CM) is not fully defined. We extended our analysis to an Indian population with genetic backgrounds and endemic and environmental status different from Africa to determine if these autoantibodies could be either a biomarker or a risk factor of developing CM.

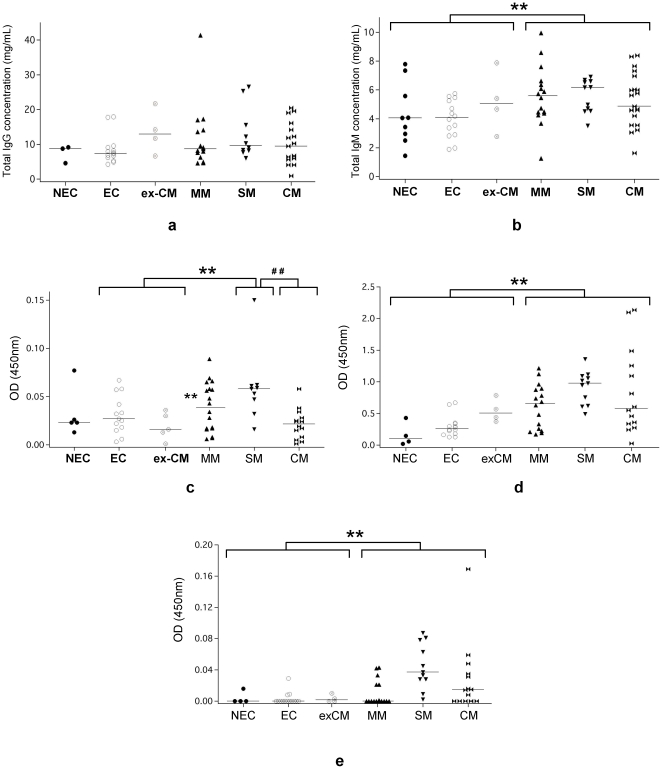
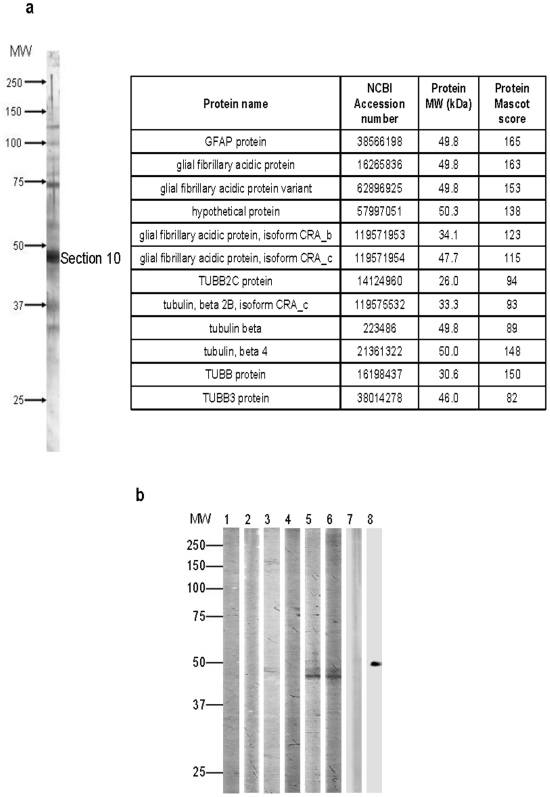
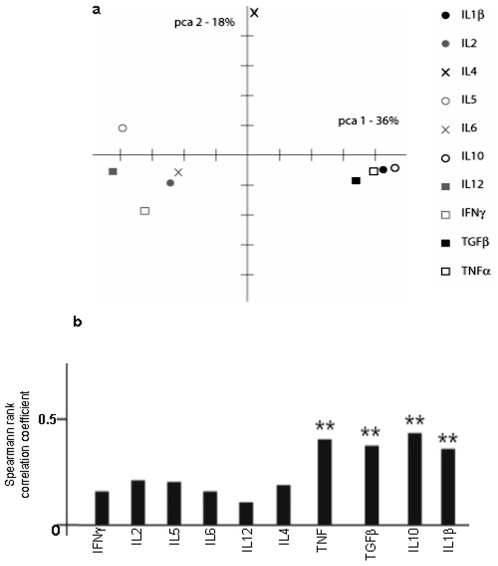
Methods/principal findings: We investigated the significance of these self-reactive antibodies in clinically well-defined groups of P. falciparum infected patients manifesting mild malaria (MM), severe non-cerebral malaria (SM), or cerebral malaria (CM) and in control subjects from Gondia, a malaria epidemic site in central India using quantitative immunoprinting and multivariate statistical analyses. A two-fold complete-linkage hierarchical clustering allows classifying the different patient groups and to distinguish the CM from the others on the basis of their profile of IgG reactivity to brain proteins defined by PANAMA Blot. We identified beta tubulin III (TBB3) as a novel discriminant brain antigen in the prevalence of CM. In addition, circulating IgG from CM patients highly react with recombinant TBB3. Overall, correspondence analyses based on singular value decomposition show a strong correlation between IgG anti-TBB3 and elevated concentration of cluster-II cytokine (IFNgamma, IL1beta, TNFalpha, TGFbeta) previously demonstrated to be a predictor of CM in the same population.

Conclusions/significance: Collectively, these findings validate the relationship between antibody response to brain induced by P. falciparum infection and plasma cytokine patterns with clinical outcome of malaria. They also provide significant insight into the immune mechanisms associated to CM by the identification of TBB3 as a new disease-specific marker and potential therapeutic target.


Conflict of interest statement

Competing Interests: The authors have declared that no competing interests exist.

Figures

Figure 1
Figure 1. Total, brain-, and P. falciparum–specific IgG and IgM responses in different groups.
Distribution of total levels of IgG (a) and IgM (b) in the different group of patients determined by Sandwich ELISA (** p = 0.003). Median level is indicated. Rate (optical density) of specific IgG against P. falciparum FAN5HS erythrocytic stage extract quantified by direct ELISA (** p = 0.008) (## p = 0.001) (c). Rate (optical density) of IgG (** p<0.001) (d) and IgM (** p = 0.002) (e) recognizing the human brain extract quantified by direct ELISA.
Figure 2
Figure 2. Correlation between total, brain-, and parasite-specific IgG responses.
(A) Correlation-based principal component analysis of the levels of IgG responses to brain and P. falciparum FAN5HS antigens and total IgG determined by ELISA from all patients. (B) Relative average contributions of the different patient groups to the two principal components shown in (A). (C). Example of immunoblot showing the reactivity of IgG from patients sera from different groups with P. falciparum FAN5HS erythrocytic stage antigens.
Figure 3
Figure 3. Profiles of IgG reactivities to brain antigens of the different P. falciparum infected groups.
(A) Example of IgG reactivity from SM, CM, or ex-CM patients sera showing the increase with disease severity and the number of brain antigens (section) reacting with patient sera. (B) Median number of sections recognized by each patient from the different groups (** p<0.001). (C). PCA factor 1 score from unadjusted IgG reactiviy profiles. Groupwise distribution of PCA factor 1 scores. PCA1 score were significantly higher in infected than control groups (** p<0.001) and in CM than other groups (* p = 0.01).
Figure 4
Figure 4. Reactivity to brain antigens of the different malaria patients group.
(A) Distribution of mean intensity reactivities of IgG from CM patients with the different sections in brain extract. The section 10 is the most recognized among 18 sections. (B) IgG reactivity with section 10 is significantly higher in CM group than other groups (** p = 0.006). (C). Correlation of IgG reactvity with two different brain extracts. PCA factor 1 (α) correspond to the IgG reactivity from CM patients with Cuban healthy brain extracts (β) represent the reactivity of a commercial protein medley sample. Correlation coefficient: R = 0.6237, Regression: p = 0.003.
Figure 5
Figure 5. Reactivity to non-infected red blood cell antigens of different groups of patients.
(A) Distribution of the mean intensity of IgG reactivity to RBC protein extract separated into sections (B) mean intensity of IgG reactivity to section 17 is significantly higher in SM than in the other groups (** p = 0.002).
Figure 6
Figure 6. Reactivity to section 10 distinguishes cerebral malaria.
(A) Hierarchical clustering of malaria patient groups according to their reactivity with brain proteins analyzed by PANAMA blots. (B) Correlation analysis of malaria patient group IgG reactivity. (C) Decomposition of correlation analysis.
Figure 7
Figure 7. Identification and characterization of proteins contain in the section 10.
(A) Protein identification by mass spectrometry. Twelve human proteins identified from the section 10. Identification of proteins was carried out as described (see material and methods). In this case, Mascot protein scores greater than 65 are significant (p<0.05). (B). Characterization of section 10 protein candidate by antibody depletion. Immunoprinting with sera depleted (d) or not depleted (nd) with TBB, TBB3, and GFAP proteins. No signal was detected at 46 kDa in CM sera depleted with TBB and TBB3 proteins in lane 3 and 4 respectively. MW, Molecular weight marker; 1, EC sera (nd); 2, EC sera (d); 3, CM sera (d) with TBB; 4, CM sera (d) with TBB3; 5, CM sera (d) with GFAP; 6, CM sera (nd); 7, TBB3 mAb (d) with TBB3; 8, TBB3 mAb (nd).
Figure 8
Figure 8. Correlation of total IgG reactivity against brain with cytokine profiles.
(A) Principal component analysis (PCA) of the Spearman rank correlations between cytokine levels and IgG reactivity towards the eighteen sections of the Panama blots for each subject in our patient cohorts. We considered the entire panel of cytokines used in our previous study (32). (B) Distribution of Spearman rank correlations of PCA factor 1 scores between IgG self-reactivity in CM patients to brains proteins and the levels of cytokines from cluster 1 (IL2, IL5, IL6, IL12, and IFN-γ) and 2 (IL1β, IL10, TNFα, and TGFβ) quantified by ELISA.

References

    1. Korenromp E. World Malaria Report: Roll Back Malaria. World Health Organization: Geneva 2004
    1. Breman JG, Egan A, Keusch GT. The intolerable burden of malaria: a new look at the numbers. Am J Trop Med Hyg. 2001;64:iv–vii. - PubMed
    1. Mazier D, Nitcheu J, Idrissa-Boubou M. Cerebral malaria and immunogentics. Parasite Immunol. 2000;22:613–23. - PubMed
    1. Miller LH, Baruch DI, Marsh K, Doumbo OK. The pathogenic basis of malaria. Nature. 2002;415:673–9. - PubMed
    1. Greenwood BM. The epidemiology of malaria. Ann Trop Med Parasitol. 1997;91:763–9. - PubMed

Publication types

MeSH terms