

The hormetic morphogen theory of curvature and the morphogenesis and pathology of tubular and other curved structures
- PMID: 20011651
- PMCID: PMC2790315
- DOI: 10.2203/dose-response.09-013.Fosslien
The hormetic morphogen theory of curvature and the morphogenesis and pathology of tubular and other curved structures
Abstract
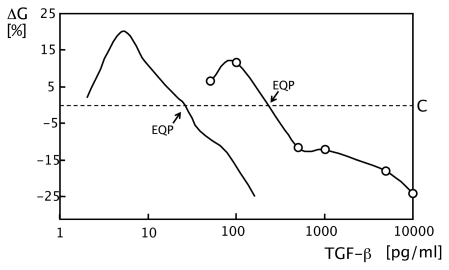
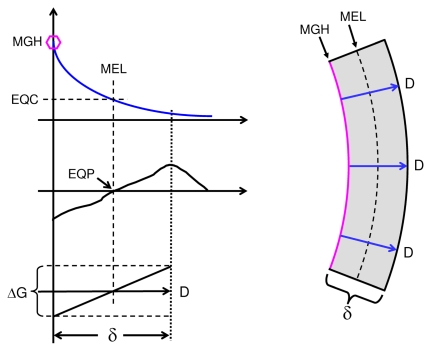
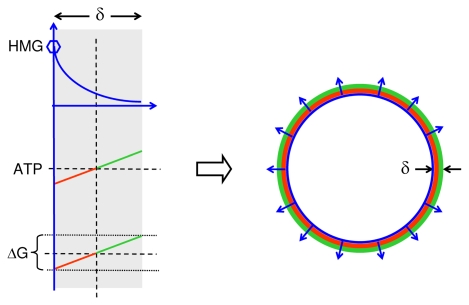
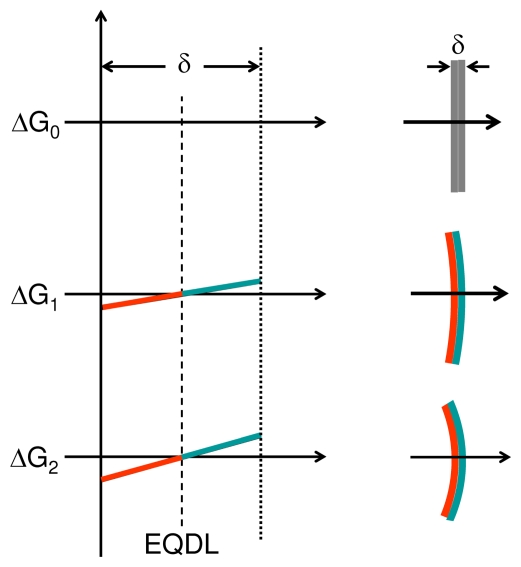
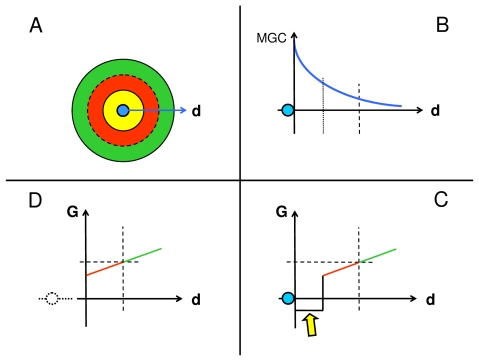
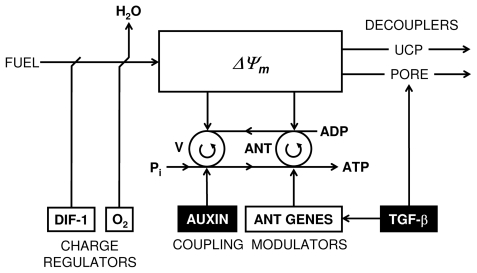
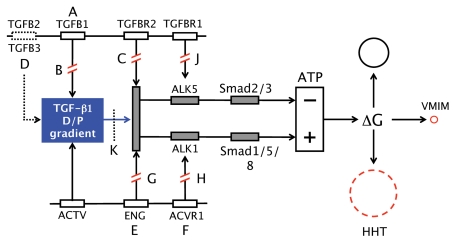
In vitro, morphogens such as transforming growth factor (TGF)-beta can up-and down-regulate cell growth at low and high concentrations respectively, i.e. they behave like hormetic agents. The hormetic morphogen theory of curvature proposes that in vivo tissue gradients of such morphogens secreted by source cells determine the fate of cells within their gradient fields (field cells) and that morphogen-induced amplitude modulation of field cell mitochondrial adenosine triphosphate (ATP) generation controls field cell growth along the morphogen gradients: At the high concentration end of gradients, field cell ATP generation and field cell growth is reduced. With declining concentrations along the rest of the gradients field cell ATP and growth is progressively less reduced until an equidyne point is reached, beyond which ATP generation and growth gradually increases. Thus, the differential growth rates along the gradients curve the tissue. Apoptosis at very high morphogen concentrations enables lumen and cavity formation of tubular, spherical, cystic, domed, and other curved biological structures. The morphogen concentration, the gradient slope and the hormesis responses of field cells determine the curvature of such structures during developmental morphogenesis, tissue remodeling and repair of injury. Aberrant hormetic morphogen signaling is associated with developmental abnormalities, vascular diseases, and tumor formation.
Keywords: Curvature; atherosclerosis; cancer; development; gradients; hormesis; hormetic morphogen; morphogenesis.
Figures
Similar articles
-
Hormetic electric field theory of pattern formation.Dose Response. 2010 Jul 26;8(4):518-26. doi: 10.2203/dose-response.10-009.Fosslien. Dose Response. 2010. PMID: 21191488 Free PMC article.
-
Theoretical and experimental models of hormetic fusion tubulogenesis.Dose Response. 2012 Jul 24;11(2):178-90. doi: 10.2203/dose-response.12-004.Fosslien. Print 2013. Dose Response. 2012. PMID: 23930100 Free PMC article.
-
Cancer morphogenesis: role of mitochondrial failure.Ann Clin Lab Sci. 2008 Autumn;38(4):307-29. Ann Clin Lab Sci. 2008. PMID: 18988924 Review.
-
Establishment, maintenance, and remodeling of curvature in biology.Med Hypotheses. 2002 Sep;59(3):233-8. doi: 10.1016/s0306-9877(02)00206-2. Med Hypotheses. 2002. PMID: 12208145
-
Shaping morphogen gradients by proteoglycans.Cold Spring Harb Perspect Biol. 2009 Sep;1(3):a002493. doi: 10.1101/cshperspect.a002493. Cold Spring Harb Perspect Biol. 2009. PMID: 20066107 Free PMC article. Review.
Cited by
-
Hormetic electric field theory of pattern formation.Dose Response. 2010 Jul 26;8(4):518-26. doi: 10.2203/dose-response.10-009.Fosslien. Dose Response. 2010. PMID: 21191488 Free PMC article.
-
Biphasic response as a mechanism against mutant takeover in tissue homeostasis circuits.Mol Syst Biol. 2017 Jun 26;13(6):933. doi: 10.15252/msb.20177599. Mol Syst Biol. 2017. PMID: 28652282 Free PMC article.
-
Hormetic signaling patterns.Dose Response. 2012;10(1):83-90. doi: 10.2203/dose-response.11-012.Wetzker. Epub 2011 Oct 14. Dose Response. 2012. PMID: 22423231 Free PMC article.
-
Theoretical and experimental models of hormetic fusion tubulogenesis.Dose Response. 2012 Jul 24;11(2):178-90. doi: 10.2203/dose-response.12-004.Fosslien. Print 2013. Dose Response. 2012. PMID: 23930100 Free PMC article.
-
The organelle of differentiation in embryos: the cell state splitter.Theor Biol Med Model. 2016 Mar 10;13:11. doi: 10.1186/s12976-016-0037-2. Theor Biol Med Model. 2016. PMID: 26965444 Free PMC article. Review.
References
-
- Agah R, Prasad KS, Linnemann R, Firpo MT, Quertermous T, Dichek DA. Cardiovascular over-expression of transforming growth factor-beta(1) causes abnormal yolk sac vasculogenesis and early embryonic death. Circ Res. 2000;86(10):1024–1030. - PubMed
-
- Barker N, Morin PJ, Clevers H. The Yin-Yang of TCF/beta-catenin signaling. Adv Cancer Res. 2000;77:1–24. - PubMed
-
- Battegay EJ, Raines EW, Seifert RA, Bowen-Pope DF, Ross R. TGF-beta induces bimodal proliferation of connective tissue cells via complex control of an autocrine PDGF loop. Cell. 1990;63(3):515–524. - PubMed
-
- Benková E, Michniewiz M, Sauer M, Teichman T, Seifertová D, Jürgens G, Friml J. Local, efflux-dependent auxin gradients as a common module for plant organ formation. Cell. 2003;115(5):591–602. - PubMed
LinkOut - more resources
Full Text Sources
