

A genome-wide association study of social and non-social autistic-like traits in the general population using pooled DNA, 500 K SNP microarrays and both community and diagnosed autism replication samples
- PMID: 20012890
- PMCID: PMC2797846
- DOI: 10.1007/s10519-009-9308-6
A genome-wide association study of social and non-social autistic-like traits in the general population using pooled DNA, 500 K SNP microarrays and both community and diagnosed autism replication samples
Abstract
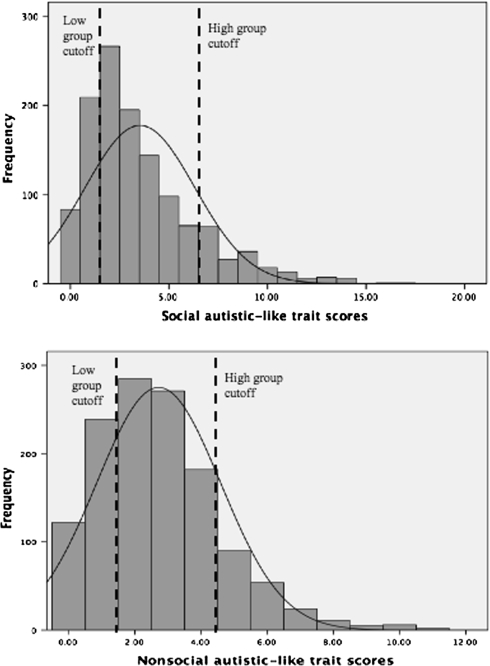
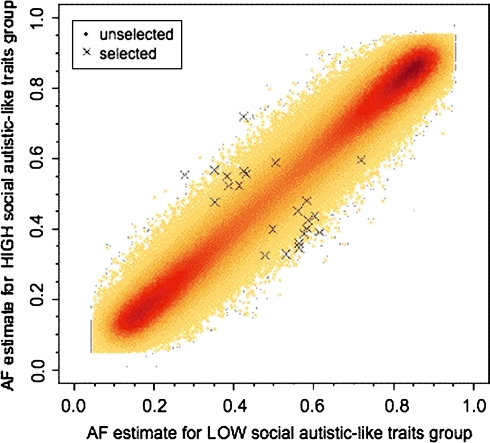
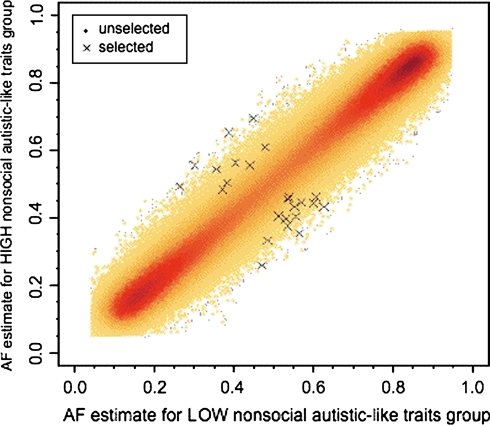
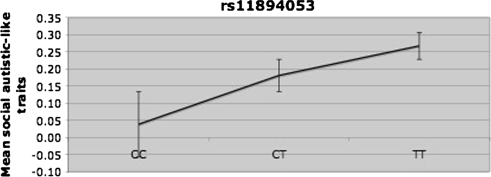
Two separate genome-wide association studies were conducted to identify single nucleotide polymorphisms (SNPs) associated with social and nonsocial autistic-like traits. We predicted that we would find SNPs associated with social and non-social autistic-like traits and that different SNPs would be associated with social and nonsocial. In Stage 1, each study screened for allele frequency differences in approximately 430,000 autosomal SNPs using pooled DNA on microarrays in high-scoring versus low-scoring boys from a general population sample (N = approximately 400/group). In Stage 2, 22 and 20 SNPs in the social and non-social studies, respectively, were tested for QTL association by individually genotyping an independent community sample of 1,400 boys. One SNP (rs11894053) was nominally associated (P < .05, uncorrected for multiple testing) with social autistic-like traits. When the sample was increased by adding females, 2 additional SNPs were nominally significant (P < .05). These 3 SNPs, however, showed no significant association in transmission disequilibrium analyses of diagnosed ASD families.
Figures
Comment in
-
Optimal selection of markers from DNA pooling experiments.Behav Genet. 2010 Jan;40(1):46-7; discussion 48. doi: 10.1007/s10519-009-9313-9. Epub 2009 Dec 13. Behav Genet. 2010. PMID: 20012889 No abstract available.
Similar articles
-
In search of genes associated with risk for psychopathic tendencies in children: a two-stage genome-wide association study of pooled DNA.J Child Psychol Psychiatry. 2010 Jul;51(7):780-8. doi: 10.1111/j.1469-7610.2010.02236.x. Epub 2010 Mar 25. J Child Psychol Psychiatry. 2010. PMID: 20345837
-
Genome-wide quantitative trait locus association scan of general cognitive ability using pooled DNA and 500K single nucleotide polymorphism microarrays.Genes Brain Behav. 2008 Jun;7(4):435-46. doi: 10.1111/j.1601-183X.2007.00368.x. Epub 2008 Jan 22. Genes Brain Behav. 2008. PMID: 18067574 Free PMC article.
-
A functional polymorphism of the OXTR gene is associated with autistic traits in Caucasian and Asian populations.Am J Med Genet B Neuropsychiatr Genet. 2017 Dec;174(8):808-816. doi: 10.1002/ajmg.b.32596. Epub 2017 Oct 13. Am J Med Genet B Neuropsychiatr Genet. 2017. PMID: 29027364
-
Genetic Risk of Autism Spectrum Disorder in a Pakistani Population.Genes (Basel). 2020 Oct 15;11(10):1206. doi: 10.3390/genes11101206. Genes (Basel). 2020. PMID: 33076578 Free PMC article.
-
The extent of linkage disequilibrium and computational challenges of single nucleotide polymorphisms in genome-wide association studies.Curr Drug Metab. 2011 Jun;12(5):498-506. doi: 10.2174/138920011795495312. Curr Drug Metab. 2011. PMID: 21453276 Review.
Cited by
-
Heritability of Autism Spectrum Disorder in a UK Population-Based Twin Sample.JAMA Psychiatry. 2015 May;72(5):415-23. doi: 10.1001/jamapsychiatry.2014.3028. JAMA Psychiatry. 2015. PMID: 25738232 Free PMC article.
-
Evidence that autistic traits show the same etiology in the general population and at the quantitative extremes (5%, 2.5%, and 1%).Arch Gen Psychiatry. 2011 Nov;68(11):1113-21. doi: 10.1001/archgenpsychiatry.2011.119. Arch Gen Psychiatry. 2011. PMID: 22065527 Free PMC article.
-
2p15-p16.1 microdeletion syndrome: molecular characterization and association of the OTX1 and XPO1 genes with autism spectrum disorders.Eur J Hum Genet. 2011 Dec;19(12):1264-70. doi: 10.1038/ejhg.2011.112. Epub 2011 Jul 13. Eur J Hum Genet. 2011. PMID: 21750575 Free PMC article.
-
Autism spectrum disorders.Eur Child Adolesc Psychiatry. 2013 Feb;22 Suppl 1:S37-42. doi: 10.1007/s00787-012-0359-5. Eur Child Adolesc Psychiatry. 2013. PMID: 23300017 Review.
-
Two Decades of Accomplishment and Progress in Behavior Genetics.Behav Genet. 2024 Nov;54(6):441-442. doi: 10.1007/s10519-024-10200-2. Behav Genet. 2024. PMID: 39382771 No abstract available.
References
-
- Alarcon M, Abrahams BS, Stone JL, Duvall JA, Perederiy JV, Bomar JM, Sebat J, Wigler M, Martin CL, Ledbetter DH, Nelson SF, Cantor RM, Geschwind DH. Linkage, association, and gene-expression analyses identify CNTNAP2 as an autism-susceptibility gene. Am J Hum Genet. 2008;82(1):150–159. doi: 10.1016/j.ajhg.2007.09.005. - DOI - PMC - PubMed
Publication types
MeSH terms
Grants and funding
LinkOut - more resources
Full Text Sources
Research Materials
